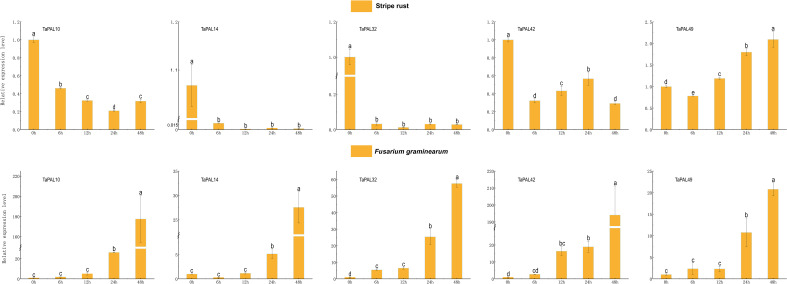
Figure 7.
Reverse transcription quantitative PCR analysis of five TaPAL genes under, F. graminearum, and P. striiformis treatment. Each bar represents the average of three replicates, and error bar represents standard deviation (SD). Different letters in a column indicate significant differences between the treatments at p < 0.05 level.

