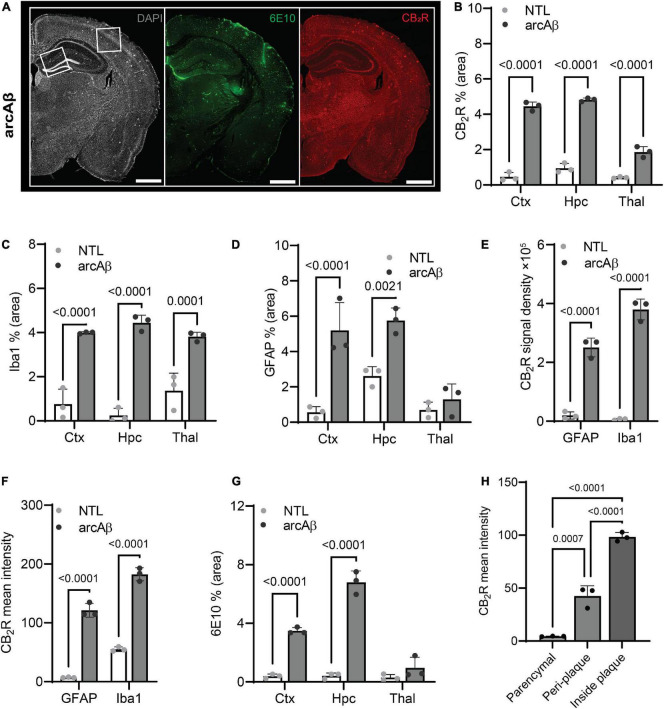
FIGURE 2.
Quantification of microgliosis-, astrocytosis-, cannabinoid type 2 receptor (CB2R), and Aβ plaque-associated enrichment in 17-month-old arcAβ mice. (A) Representative CB2R (red) and 6E10 (Aβ, green) staining in half hemisphere of one arcAβ mouse brain. White boxes in panel (A) indicate the regions including cortex (Ctx), cornu ammonus 1 (CA1) region of the hippocampus (Hpc) that zoomed-in in Figure 1. Scale bar = 1 mm. (B) Increased CB2R (% area) in the Ctx, Hpc, and thalamus (Thal) of arcAβ mice (n = 3) compared to non-transgenic littermates (NTLs, n = 3). (C,D) Increased levels of Iba1 (% area) in the Ctx, Hpc, and Thal and GFAP (% area) in the Ctx and Hpc of arcAβ mice (n = 3) compared to NTL (n = 3). (E,F) Increased CB2R signal density and mean signal intensity on both GFAP+ astrocytes and Iba1+ microglia of arcAβ mice (n = 3) compared to NTL (n = 3). (G) Increased 6E10 staining of Aβ plaque in the Ctx and Hpc of arcAβ mice (n = 3) compared to NTL (n = 3). (H) CB2R mean signal intensity on the glia inside plaque is higher than peri-plaque, with low background signal in the parenchymal of arcAβ mice. Data are presented as the mean ± standard deviation.

