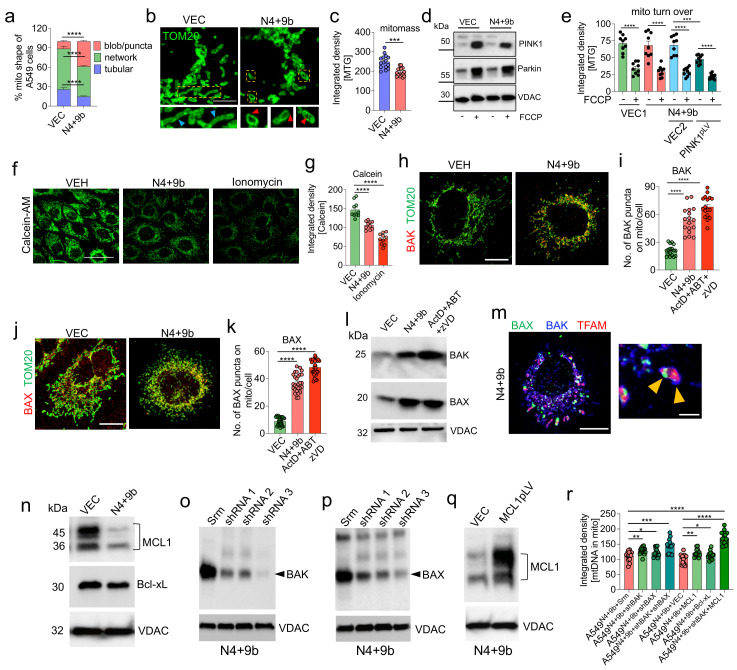
Figure 4.
NSP4 and ORF9b induce mitochondrial macropore formation and consequently promote mitochondrial DNA (mtDNA) release. (a) Quantitative analysis of mitochondrial morphology changes in cells transduced with vector (VEC) or NSP4 + ORF9b (N4 + 9B) constructs and stained with MitoTracker Red (MTR) (n = 10 images). Representative images are shown in Figure S5a. (b) Representative LIGHTNING microscopy images showing healthy tubular mitochondrial morphology in VEC-transduced (insets with blue arrowheads) cells and puncta-shaped mitochondria (indicating mitochondrial damage) in N4 + 9b (insets with red arrowheads) construct-transduced cells. (c) Quantitative analysis of confocal images of cells transduced with VEC or N4 + 9b constructs and stained with MitoTracker Green (MTG) (representing mitochondrial mass (mitomass)) (n = 15). Data are plotted as integrated density. (d) Representative immunoblots showing the expression of PINK1 and Parkin in cells transduced with VEC or N4 + 9b and treated with carbonyl cyanide 4-(trifluoromethoxy)phenylhydrazone (FCCP) for 2 h. VDAC was used as the reference control. (e) Quantitative analysis of mitochondrial turnover indicated by the loss of the MTG signal under the conditions mentioned in (d) (n = 9). Data are plotted as integrated density. VEC1 refers to the backbone vector of NSP4 and ORF9b, whereas VEC2 refers to the vector in which MCL1 was cloned (f) Representative confocal images showing calcein-AM-stained cells to indicate mitochondrial permeability transition pore opening. Ionomycin (treatment for 2 h) was used as a positive control. (g) Quantitative analysis of images (n = 10) for the experiment described in (f). Data are plotted as integrated density. (h) Representative confocal images of cells treated as indicated and subjected to BAK (red) and TOM20 (green) immunostaining. (i) Analysis of images (n = 17) in (h) to quantify the BAK puncta associated with the mitochondria. The combination of actinomycin D, ABT-737, and zVD (ActD + ABT + zVD; reported to upregulate BAX and BAK levels on the mitochondria) was used as a positive control. (j) Representative confocal images of cells treated as indicated and subjected to BAX (red) and TOM20 (green) immunostaining. (k) Analysis of images (n = 27) in (j) to quantify the BAK puncta associated with the mitochondria. The combination of ActD + ABT + zVD was used as a positive control. (l) Representative immunoblots showing the expression of BAK and BAX in the mitochondrial extracts of cells transduced with VEC or N4 + 9b constructs. VDAC was used as the reference control. The combination of ActD + ABT + zVD was used as the positive control. (m) Representative confocal images of N4 + 9b construct-transduced cells showing mtDNA (TFAM; red) associated with the BAK (blue) and BAX (green) puncta, representing macropore formation. In the insets, yellow arrowheads show the colocalization of mtDNA with the BAK/BAX macropore. (n) Representative immunoblots showing MCL1 and Bcl-xL expression in cells transduced with VEC or N4 + 9b constructs. VDAC was used as the reference control. (o,p) Representative immunoblots showing the expression of BAK (o) and BAX (p) in cells co-transduced with the N4 + 9b construct and shRNA as indicated. VDAC was used as the reference control. (q) Representative immunoblots showing MCL1 expression in cells co-transduced with the N4 + 9b construct and vector (VEC) or MCL1. VDAC was used as the reference control. (r) Quantitative analysis of images (n = 15) of cells treated as indicated and immunostained with the anti-TFAM (representing mtDNA) antibodies. Data show signals associated with the anti-TOM20 antibody-stained mitochondria. Data are plotted as integrated density. All data are represented as mean ± standard error of mean from three independent experiments. Statistical analyses (unpaired t-tests (a,c,g,l,k) and one-way analysis of variance (e,r)) were performed using Graphpad Prism software. * p < 0.05, ** p < 0.01; *** p < 0.001; **** p < 0.0001; ns: not significant. Scale bars: 5 (b), 50 (f), or 10 μm (h,i,m).

