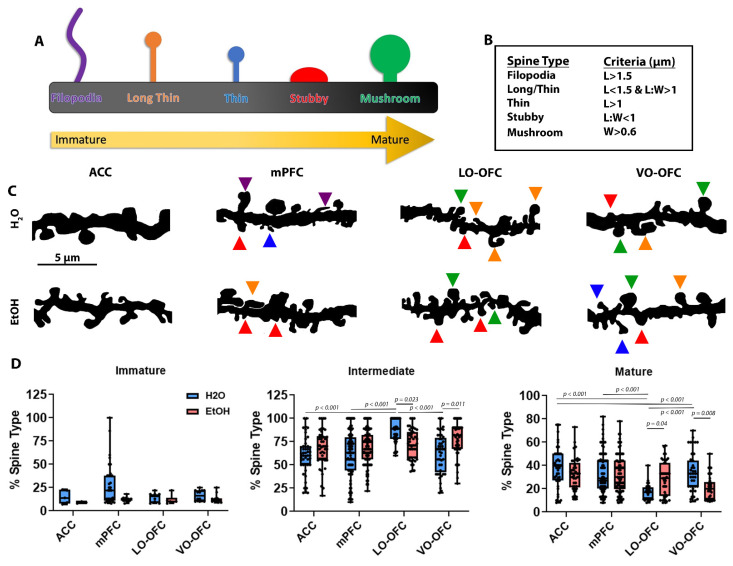
Figure 4.
The effects of AIE on dendritic spine maturation after a 26-day forced abstinence period. (A) Cartoon representation of the classification of different dendritic spine types and how they correlate to maturation. (B) Table depicting how dendritic spines are classified. (C) Representative images of secondary dendrites depicting spine types in the ACC, mPFC (IL/PL), LO-OFC, and VO-OFC. Triangles indicate spine type based on color: Filopodia—purple; Long Thin—orange; Thin—blue; Stubby—red; Mushroom—green. (D) Analysis of dendritic spine maturation in the ACC, mPFC (IL and PL), LO-OFC, and VO-OFC. There was no change in the % of immature dendritic spines in any subregion (p > 0.05) following AIE or when comparing subregions (p > 0.05). In the LO-OFC, there was a significant decrease in intermediate spines (p = 0.023) and an increase in mature spines (p = 0.04) following AIE. In the VO-OFC, there was a significant increase in intermediate spines (p = 0.011) and a significant decrease in mature spines (p = 0.008) following AIE. Data presented as box and whisker plots with interquartile range with mean, minimum, and maximum measures indicated along with individual data points. Average spine densities were calculated using 2–3 separate dendrites from at least 4–5 separate image stacks per animal for a total of 15 dendritic branches/animal (n = 3/treatment group). Analysis: two-way ANOVA with Tukey’s post hoc comparison.

