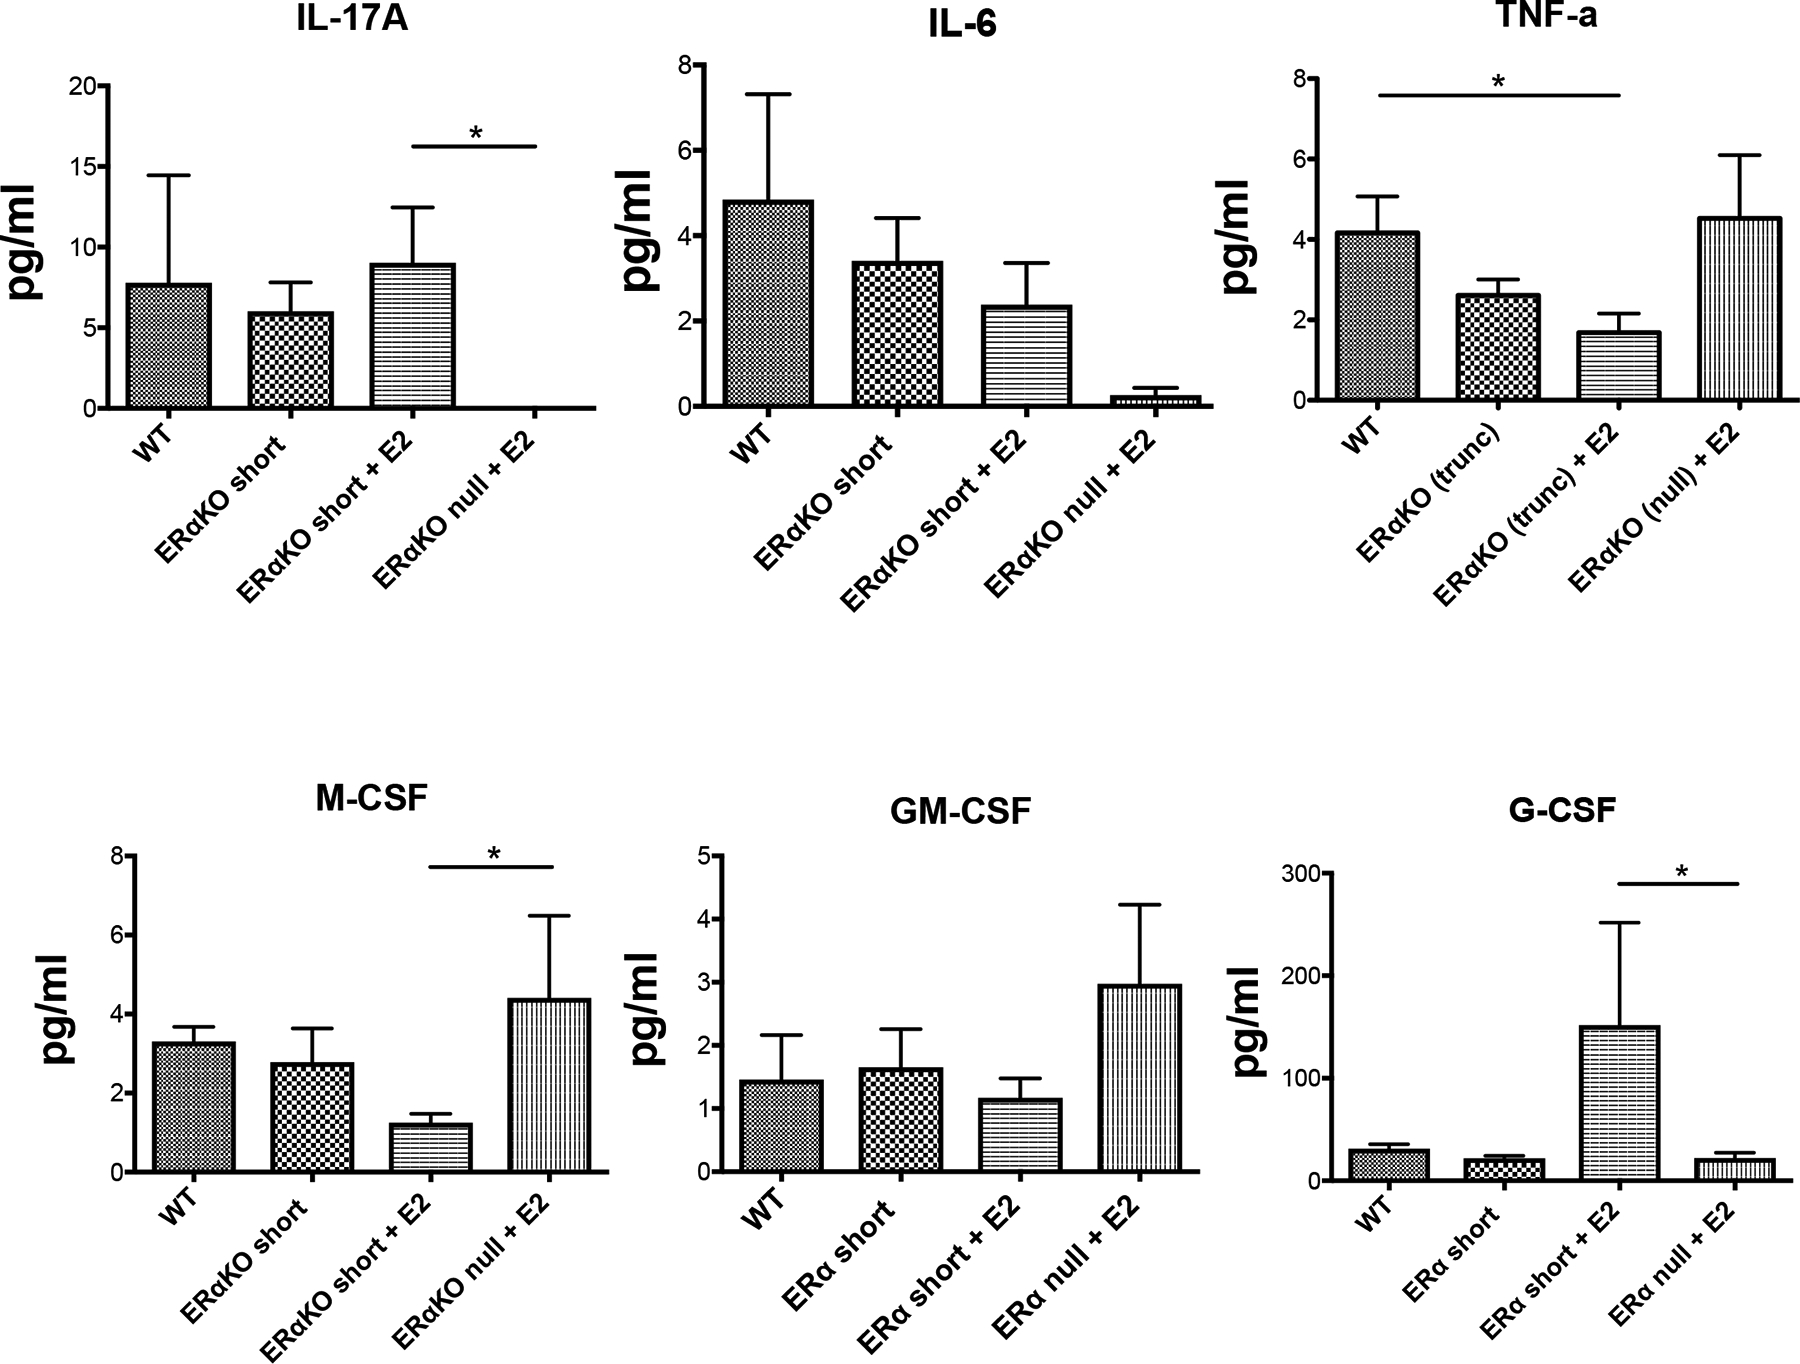
Figure 2 – Cytokine protein expression levels in NZM2410 mice with variable forms of ERα expression ± E2.

Cytokine protein expression levels were determined using a multiplex array (FlexMap). Observed results in pg/ml for IL-17A (Panel A), IL-6 (Panel B), TNFα (Panel C), M-CSF (Panel D), GM-CSF (Panel E), and G-CSF (Panel F) are displayed. All mice were ovariectomized (pre-pubertal), and serum samples were taken at sacrifice. Significance is based on a t-test, with the exception of Panel C, whose results were significant based on ANOVA with post-hoc Tukey’s test for multiple comparisons.
