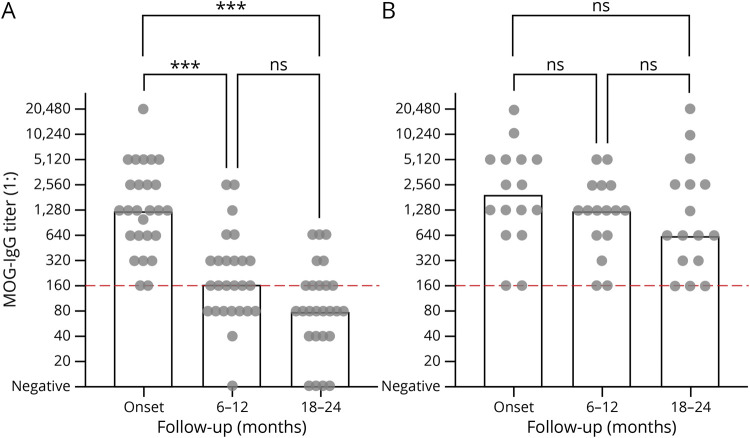
Figure 2. Comparison of MOG-IgG Titers During Disease Course Between Monophasic and Relapsing Pediatric Patients.
Comparison of MOG-IgG titers between monophasic (n = 26) and relapsing (n = 16) pediatric patients in children with serial follow-up in years 1 (months 6–12) and 2 (months 18–24) after onset. MOG-IgG titers show a statistically significant decrease during the first and second years in monophasic patients (A, overall p < 0.001), in contrast to a lower decline during the first and second years in relapsing patients (B, overall p = 0.05). Individual data points in A and B are shown as dots and medians as bars. Groups were statistically compared using the Friedman test and Dunn multiple comparison tests. ***Significant difference to onset at p < 0.001, ns = statistically not significant. IgG = immunoglobulin G; MOG = myelin oligodendrocyte glycoprotein.

