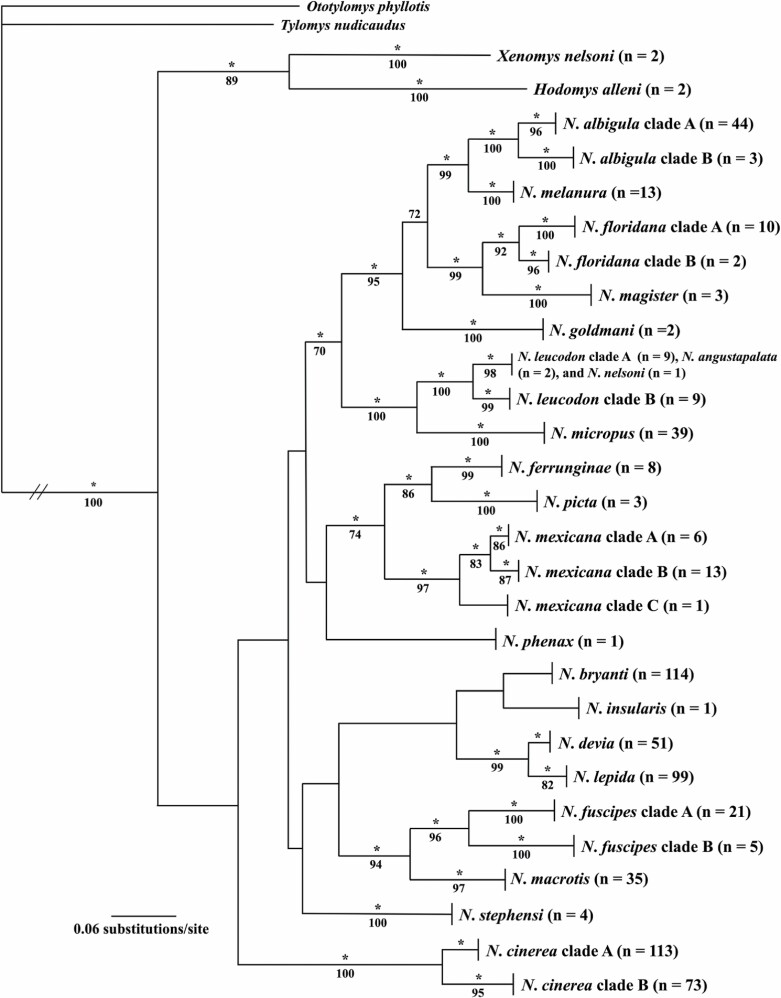
Fig. 1.
Phylogenetic tree generated using Bayesian methods (MrBayes; Huelsenbeck and Ronquist 2001), the GTR+I+G model of evolution, and 691 DNA sequences obtained from the mitochondrial Cytb gene for the 23 species of Neotoma and allies examined in this study. Clade probability values (≥ 0.95) are indicated by an asterisk and are depicted above branches and bootstrap support values (≥ 70) obtained from the maximum likelihood analysis (RaxML Version 8.2.12, Stamatakis 2014) of the same data set are depicted below the branches.

