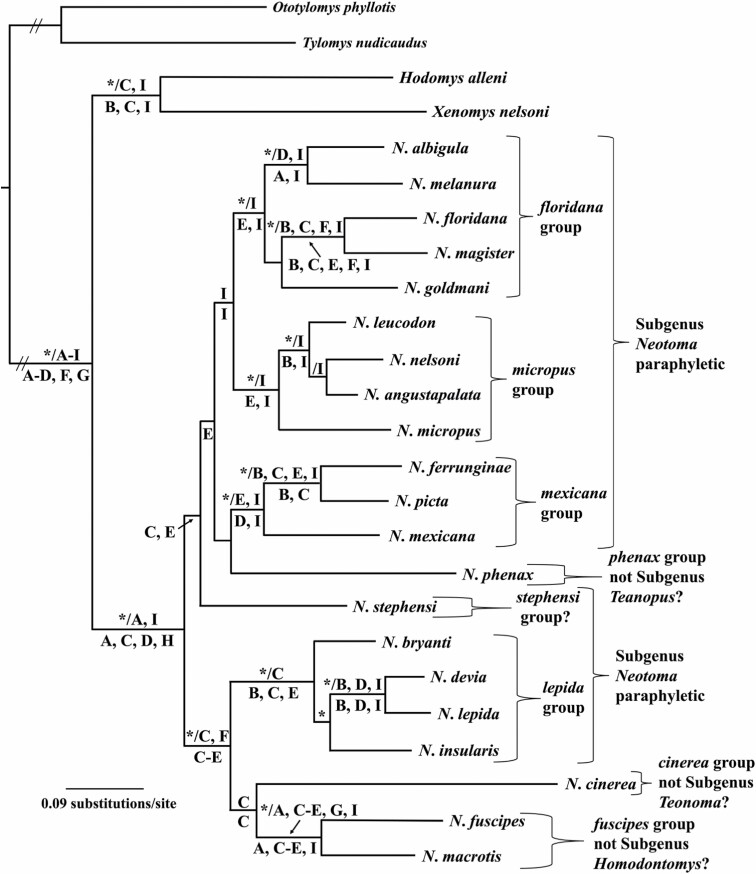
Fig. 2.
Phylogenetic tree generated using Bayesian methods (MrBayes; Huelsenbeck and Ronquist 2001), the GTR+I+G model of evolution, and a single data set represented by concatenated DNA sequences obtained from nine individual genes (four mitochondrial loci: 12S, 16S, CoII, and Cytb - denoted by A, B, E, and I, respectively; five nuclear loci: AdhI2, BfibI7, En2, Mlr, and Myh6 - denoted by C, D, F, G, and H, respectively) for the 23 species of Neotoma examined in this study. Clade probability values (≥ 0.95) are placed above branches and depicted by an asterisk (*) to the left of the slash (/). Results of the maximum likelihood (ML; RaxML Version 8.2.12, Stamatakis 2014) and parsimony analysis (PARS, PAUP* Version 4.0a167; Swofford 2002) of individual genes (A–I) were superimposed on the Bayesian inference topology. Bootstrap support values (≥ 70) obtained from the ML analysis of individual genes (A–I) were placed above branches and to the right of the slash (/). Bootstrap support values (≥ 70) obtained from the PARS analysis of individual genes (A–I) were placed below branches.

