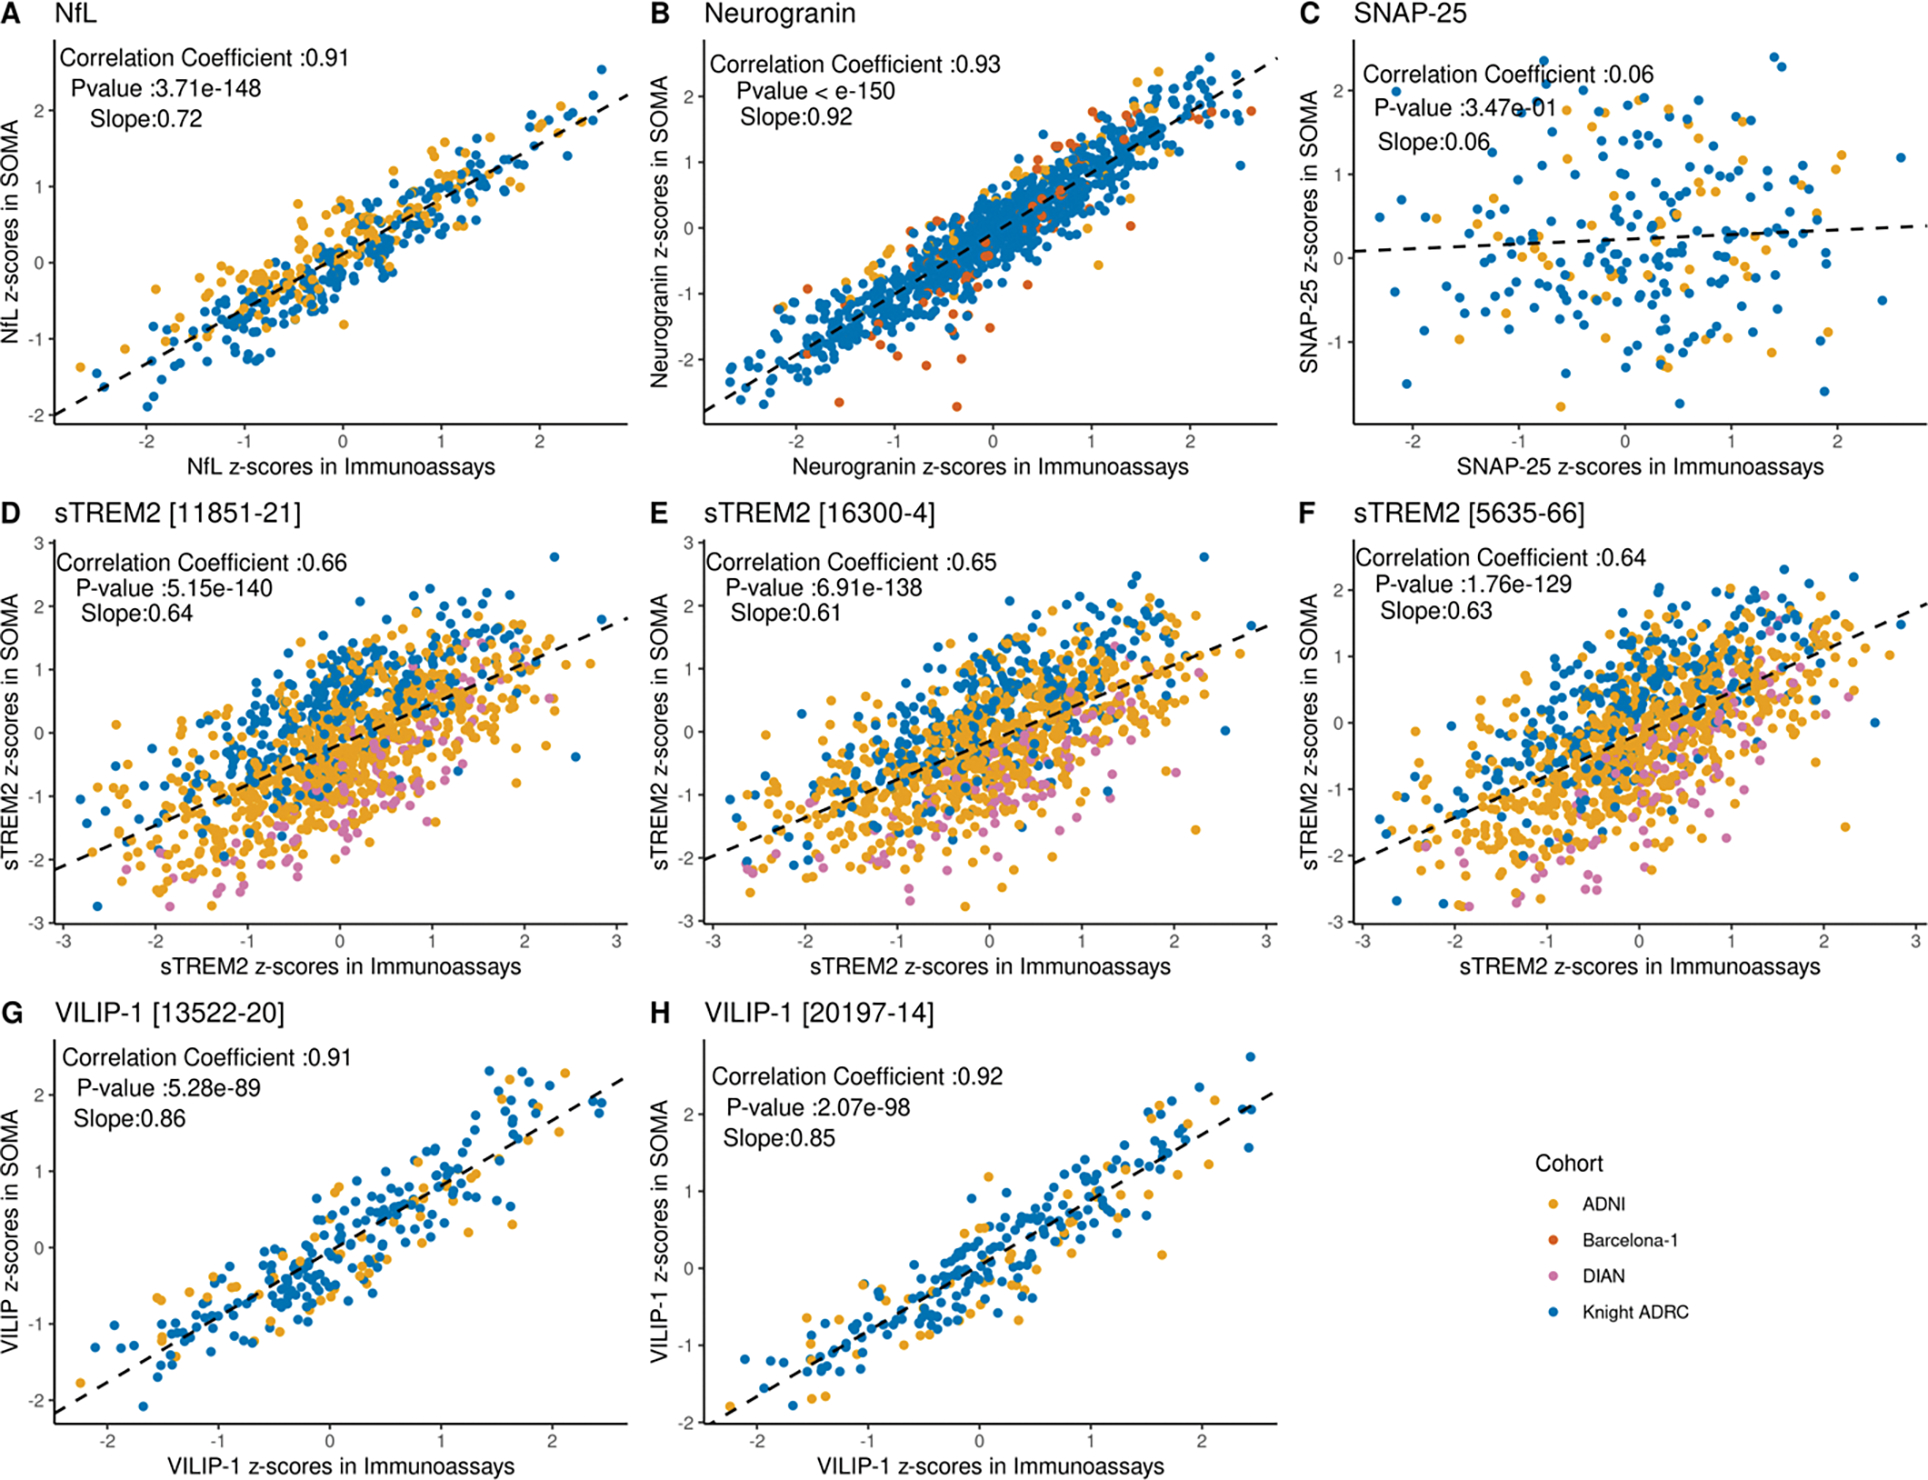
Figure 2: Correlations between SOMAscan and immunoassay platforms for different proteins across cohorts.

For each protein, Pearson’s correlation coefficient was calculated using the Z-scores from all common samples between the two platforms across all available cohorts. Significance was determined based on a p-value threshold of 0.05. Data points are color coded to show the cohort source. Slope in each plot corresponds to a regression line fitted using Immunoassay score as independent variable and SOMA score as dependent variable. (A) Scatter plot showing the correlation of standard scores for NfL protein (r = 0.91 and p-value = 3.71 × 10−148) (B) Scatter plot showing the correlation of standard scores for neurogranin protein (r = 0.93 and p-value <10−150) (C) Scatter plot showing the correlation of standard scores for SNAP-25 protein (r = 0.06 and p value = 0.35) (D-F) Scatter plot showing the correlation of standard scores for sTREM2. Three aptamers targeting sTREM2 proteins were available in the SOMAscan panel. Correlation was evaluated for all three aptamers. (r = 0.64 to 0.66; p-value = 5.15 × 10−140 to 1.76× 10−129) (G-H) Scatter plots showing the correlation of standard scores for two different aptamers targeting VILIP-1 protein (r = 0.91; p-value = 5.28 × 10−89 and 0.92; p-value = 2.07 × 10−98 respectively).
