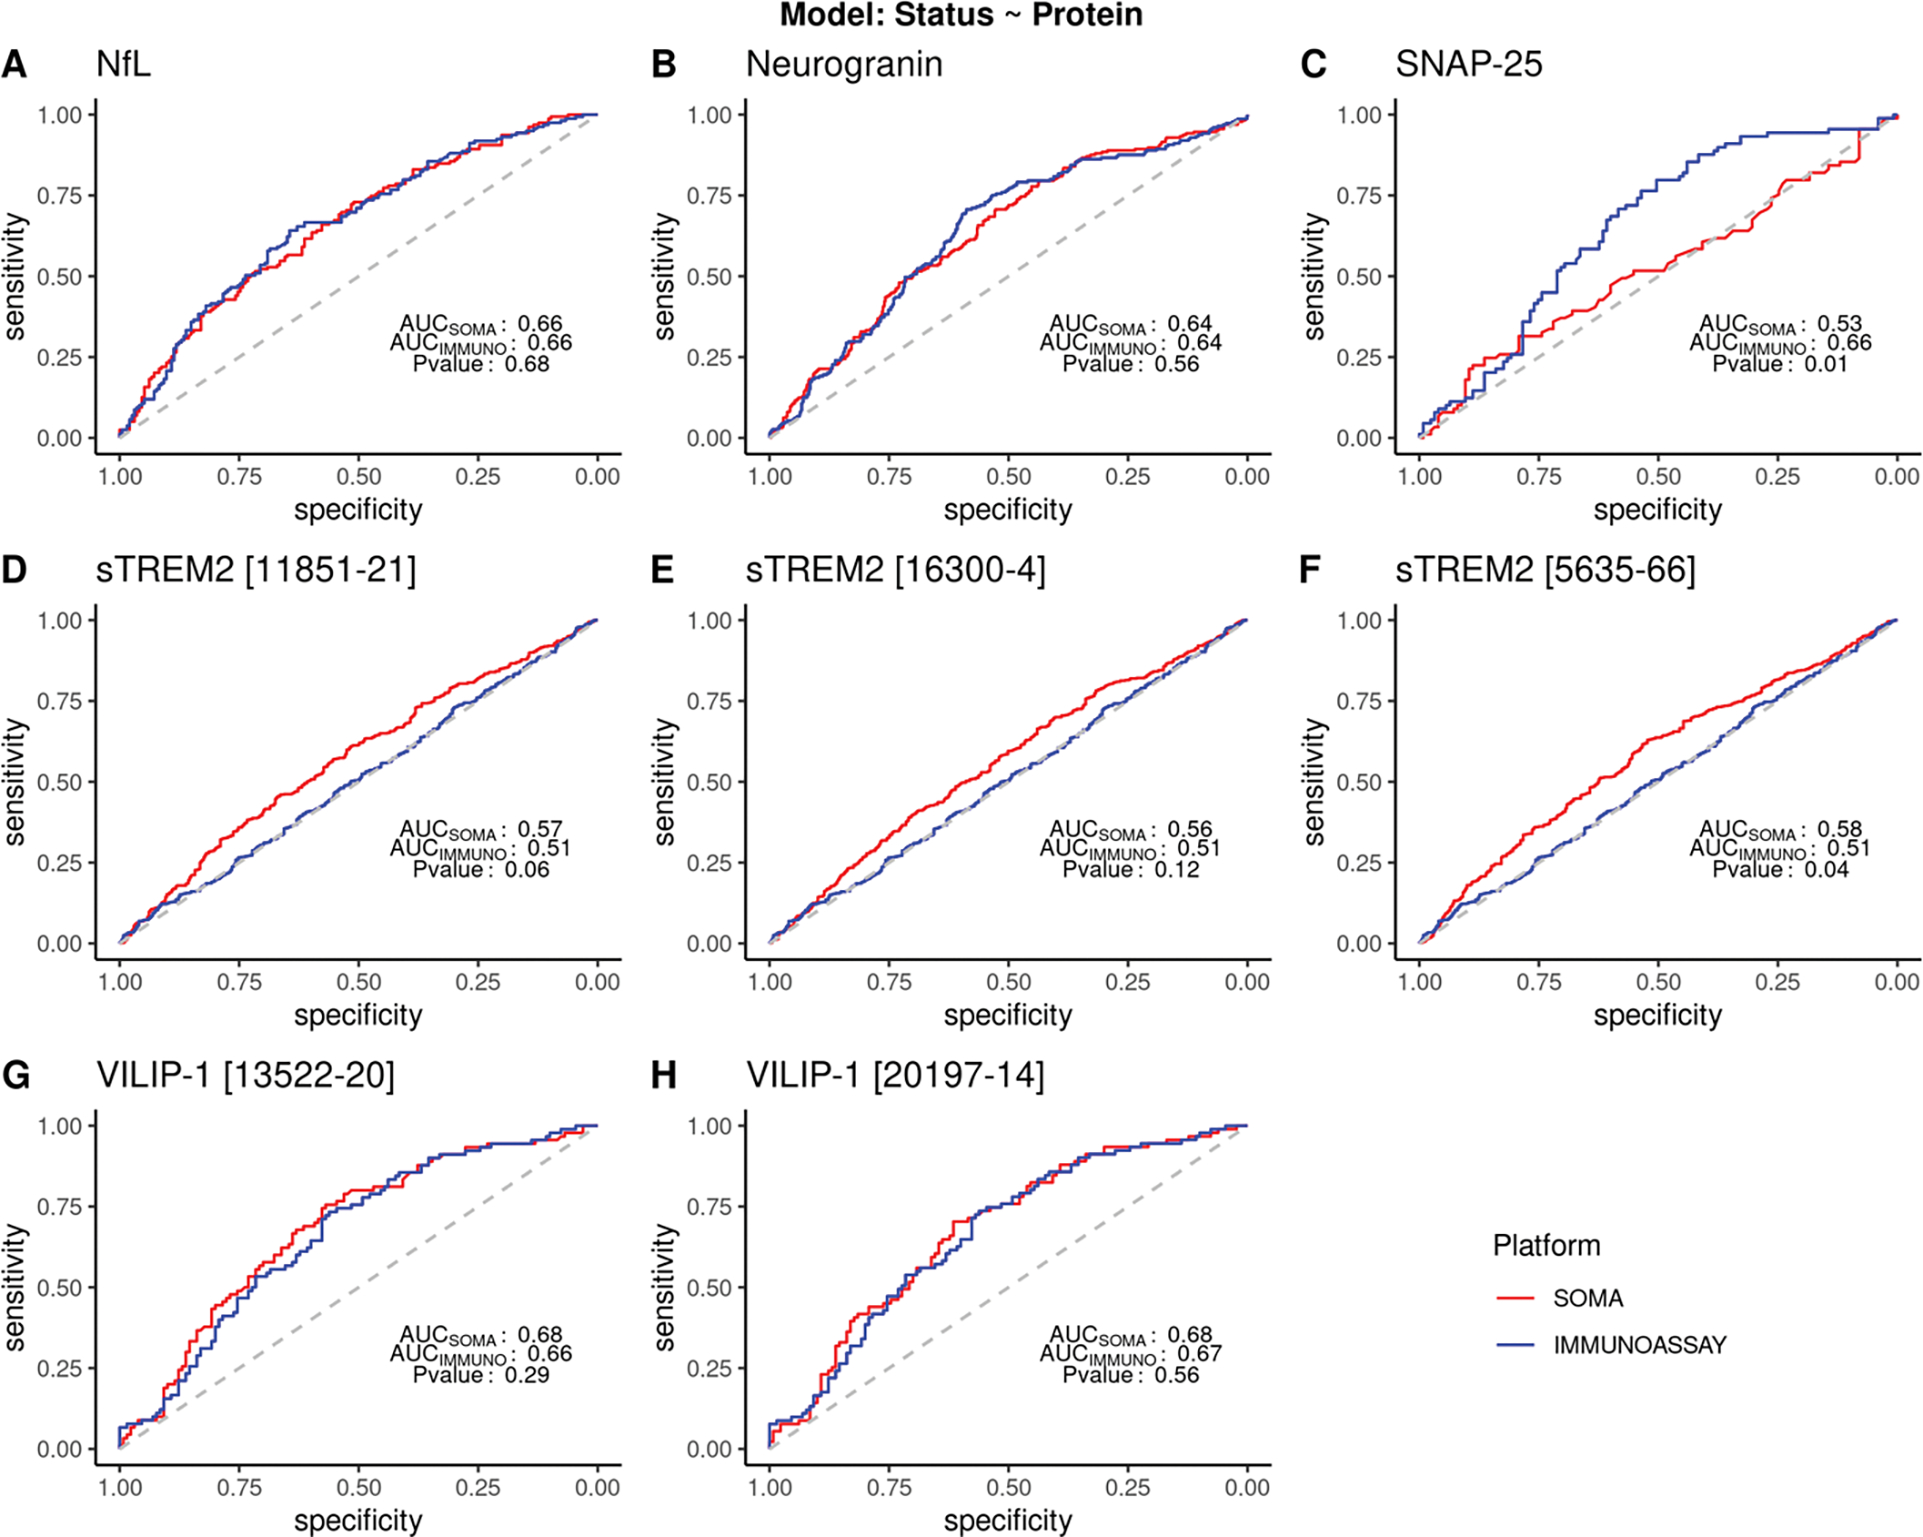
Figure 3: ROC curve showing sensitivity and specificity for different proteins in SOMAscan and immunoassay platforms.

ROC and AUC were calculated using a logistic model with protein standard scores as the predictor variable and disease status as the response variable. Clinical disease status reported at the time of CSF draw was used. Common samples from all cohorts were combined and analyzed. sTREM2 analyses included samples from Knight ADRC and ADNI only. Samples reported to have status other than cases or controls were excluded from the analysis. P<0.05 denotes significant difference in the ROC between the platforms. (A) ROC curve for NfL (AUC= 0.66 for SOMAscan and immunoassay; p= 0.68). (B) ROC curve for neurogranin (AUC 0.64 for SOMAscan and immunoassay; p value = 0.56) (C) ROC curve for SNAP-25 (AUC for SOMAscan = 0.53 and for immunoassay = 0.66 respectively; with p-value of 0.01) (D-F) ROC curve for three aptamers from the SOMAscan panel for sTREM2. (AUC for SOMAscan = 0.56 −0.58; AUC for immunoassay= 0.51; p -value = 0.04 −0.12) (G-H) ROC curve for two aptamers from the SOMAscan panel targeting VILIP-1 protein (AUC values: 0.68 for SOMAscan; 0.67 and 0.66 for immunoassay; p- value = 0.56 and 0.29) respectively.
