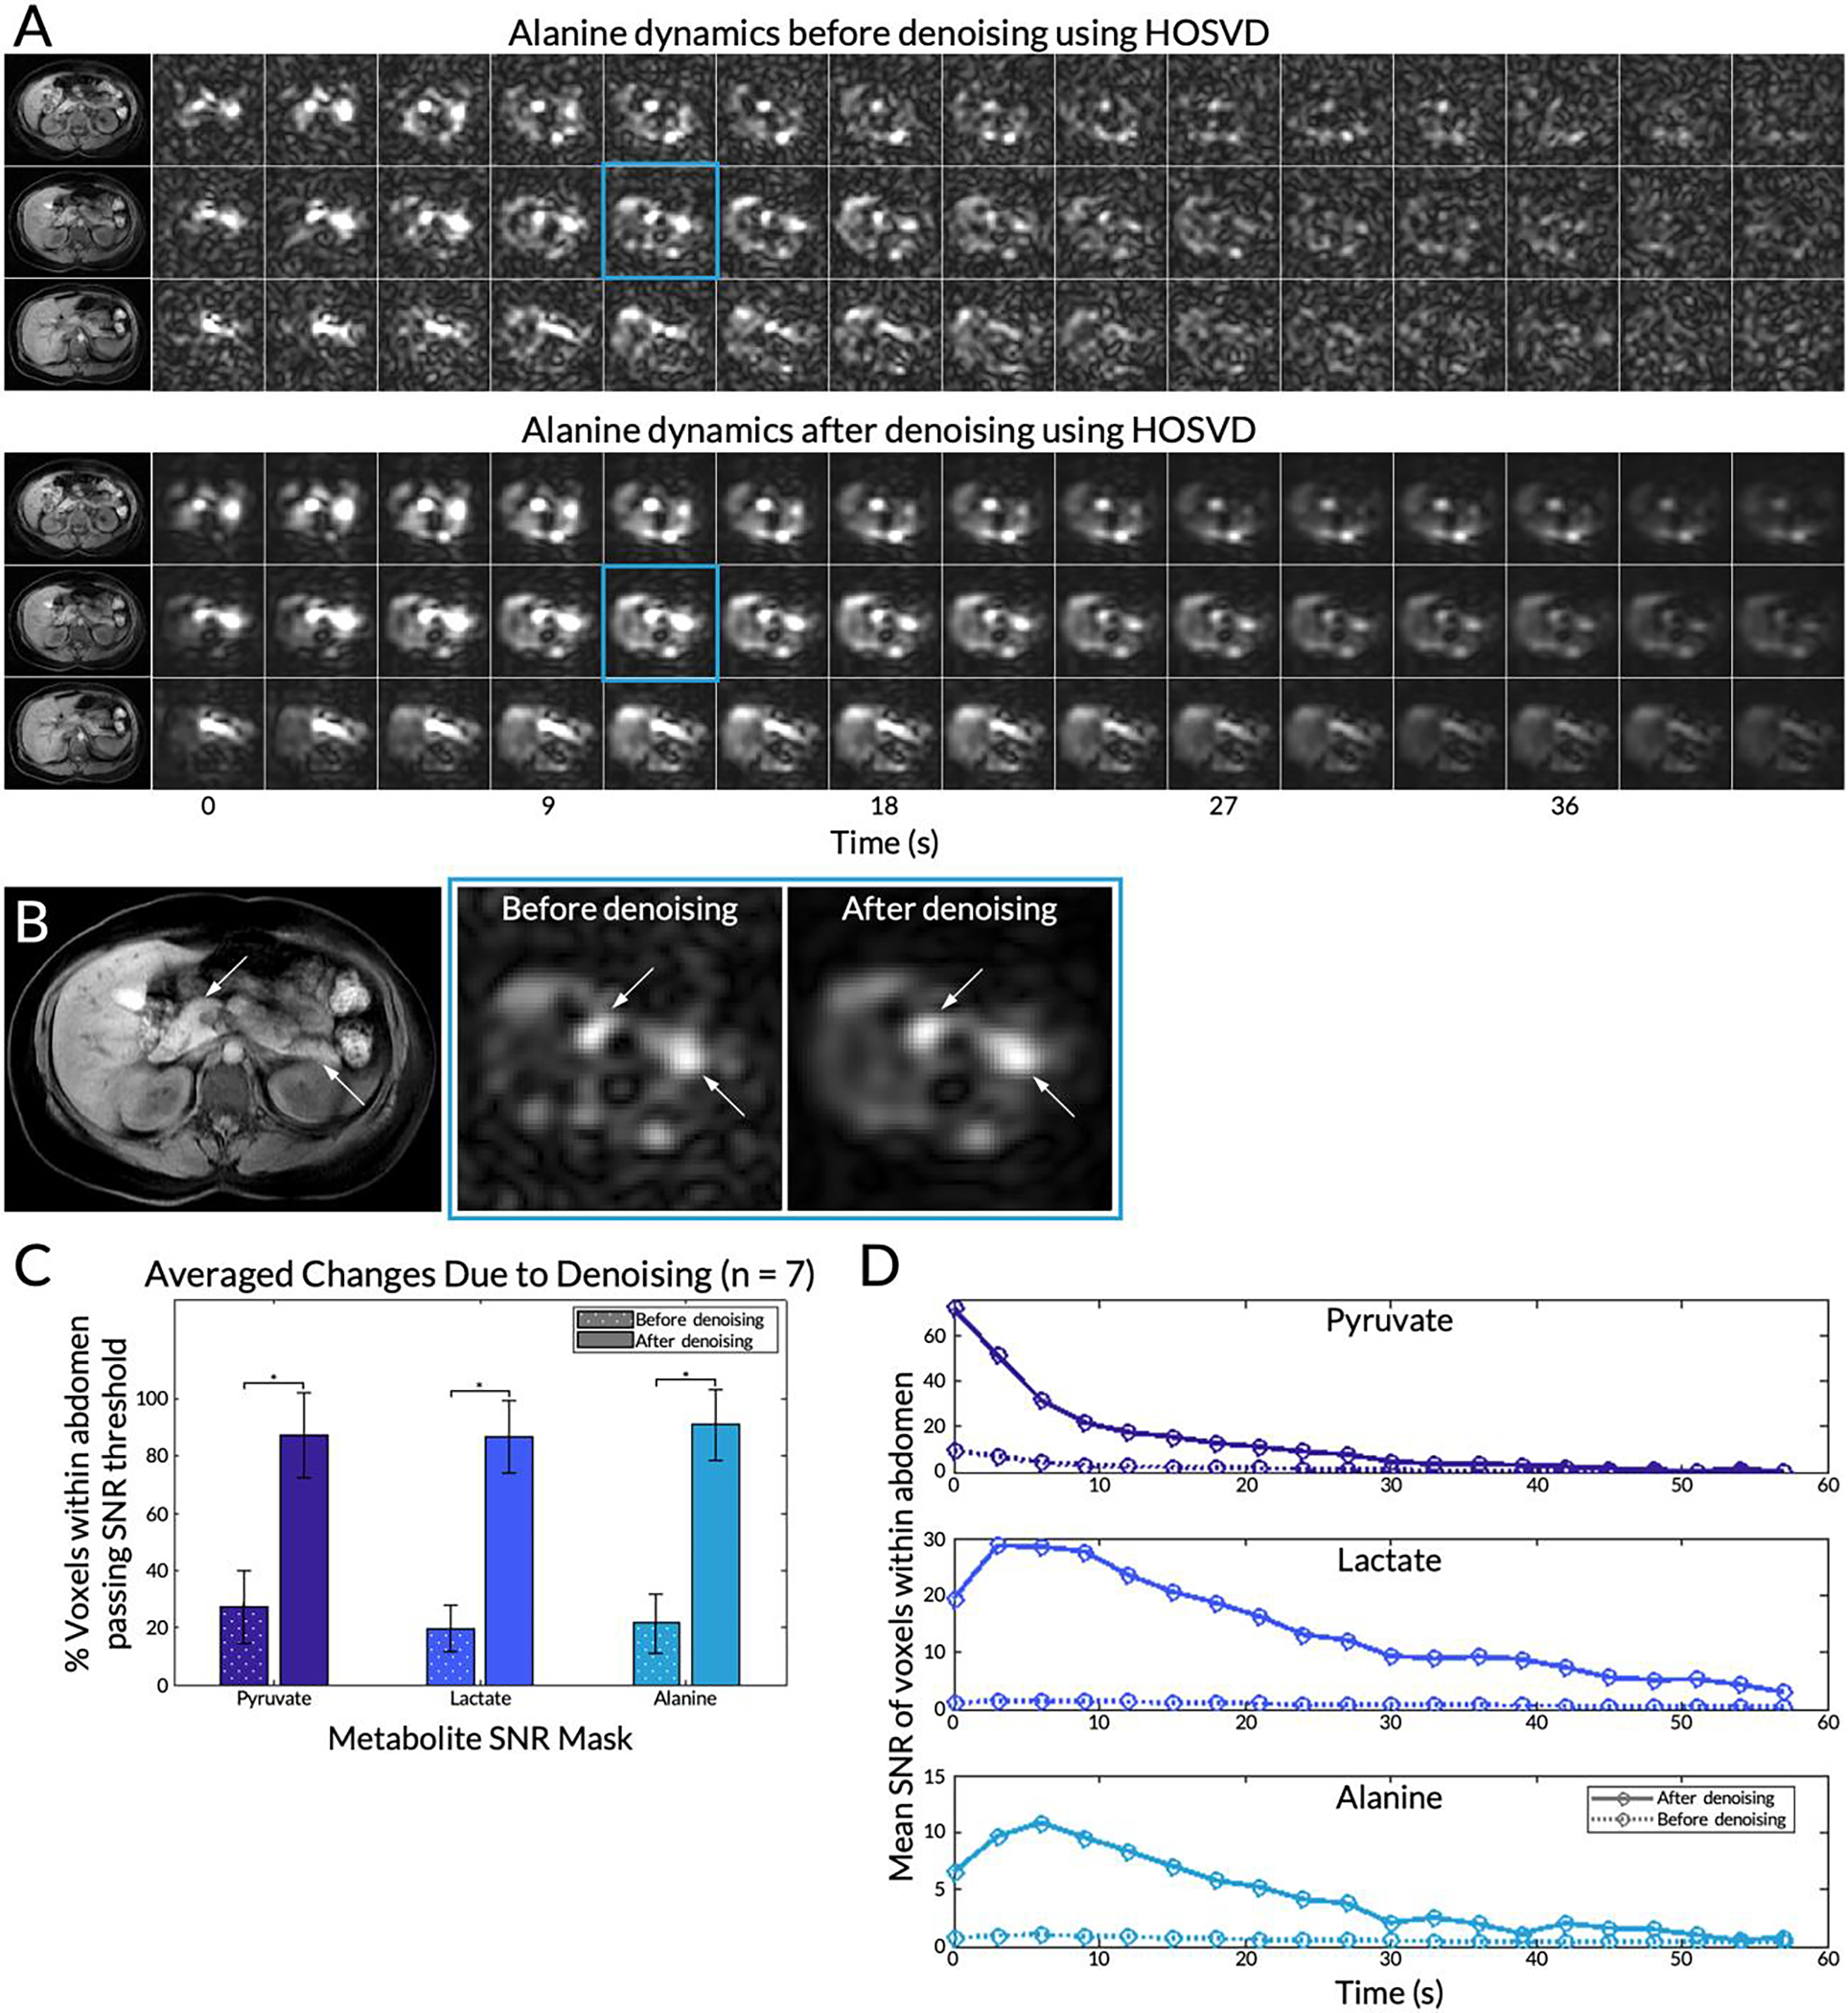
Figure 4.

(A) The first 42 seconds of the alanine dynamics before and after patch-based higher-order singular value decomposition (HOSVD) denoising for three slices from a representative subject. Corresponding T1-weighted anatomical references are on the left. (B) Detailed view of the fifth timepoint images (time = 12 s) of the central 13C slice before and after denoising enlarged. Left and right arrows point to the head and tail of the pancreas, respectively. (C) Percent of voxels passing the SNR thresholds for each metabolite before and after denoising. Error bars indicate standard deviations. A single asterisk * denotes statistical significance. (D) For the same slice highlighted in (B), the mean SNR of voxels within the whole abdomen before and after denoising over the course of the 20 timepoints.
