
Figure 5.
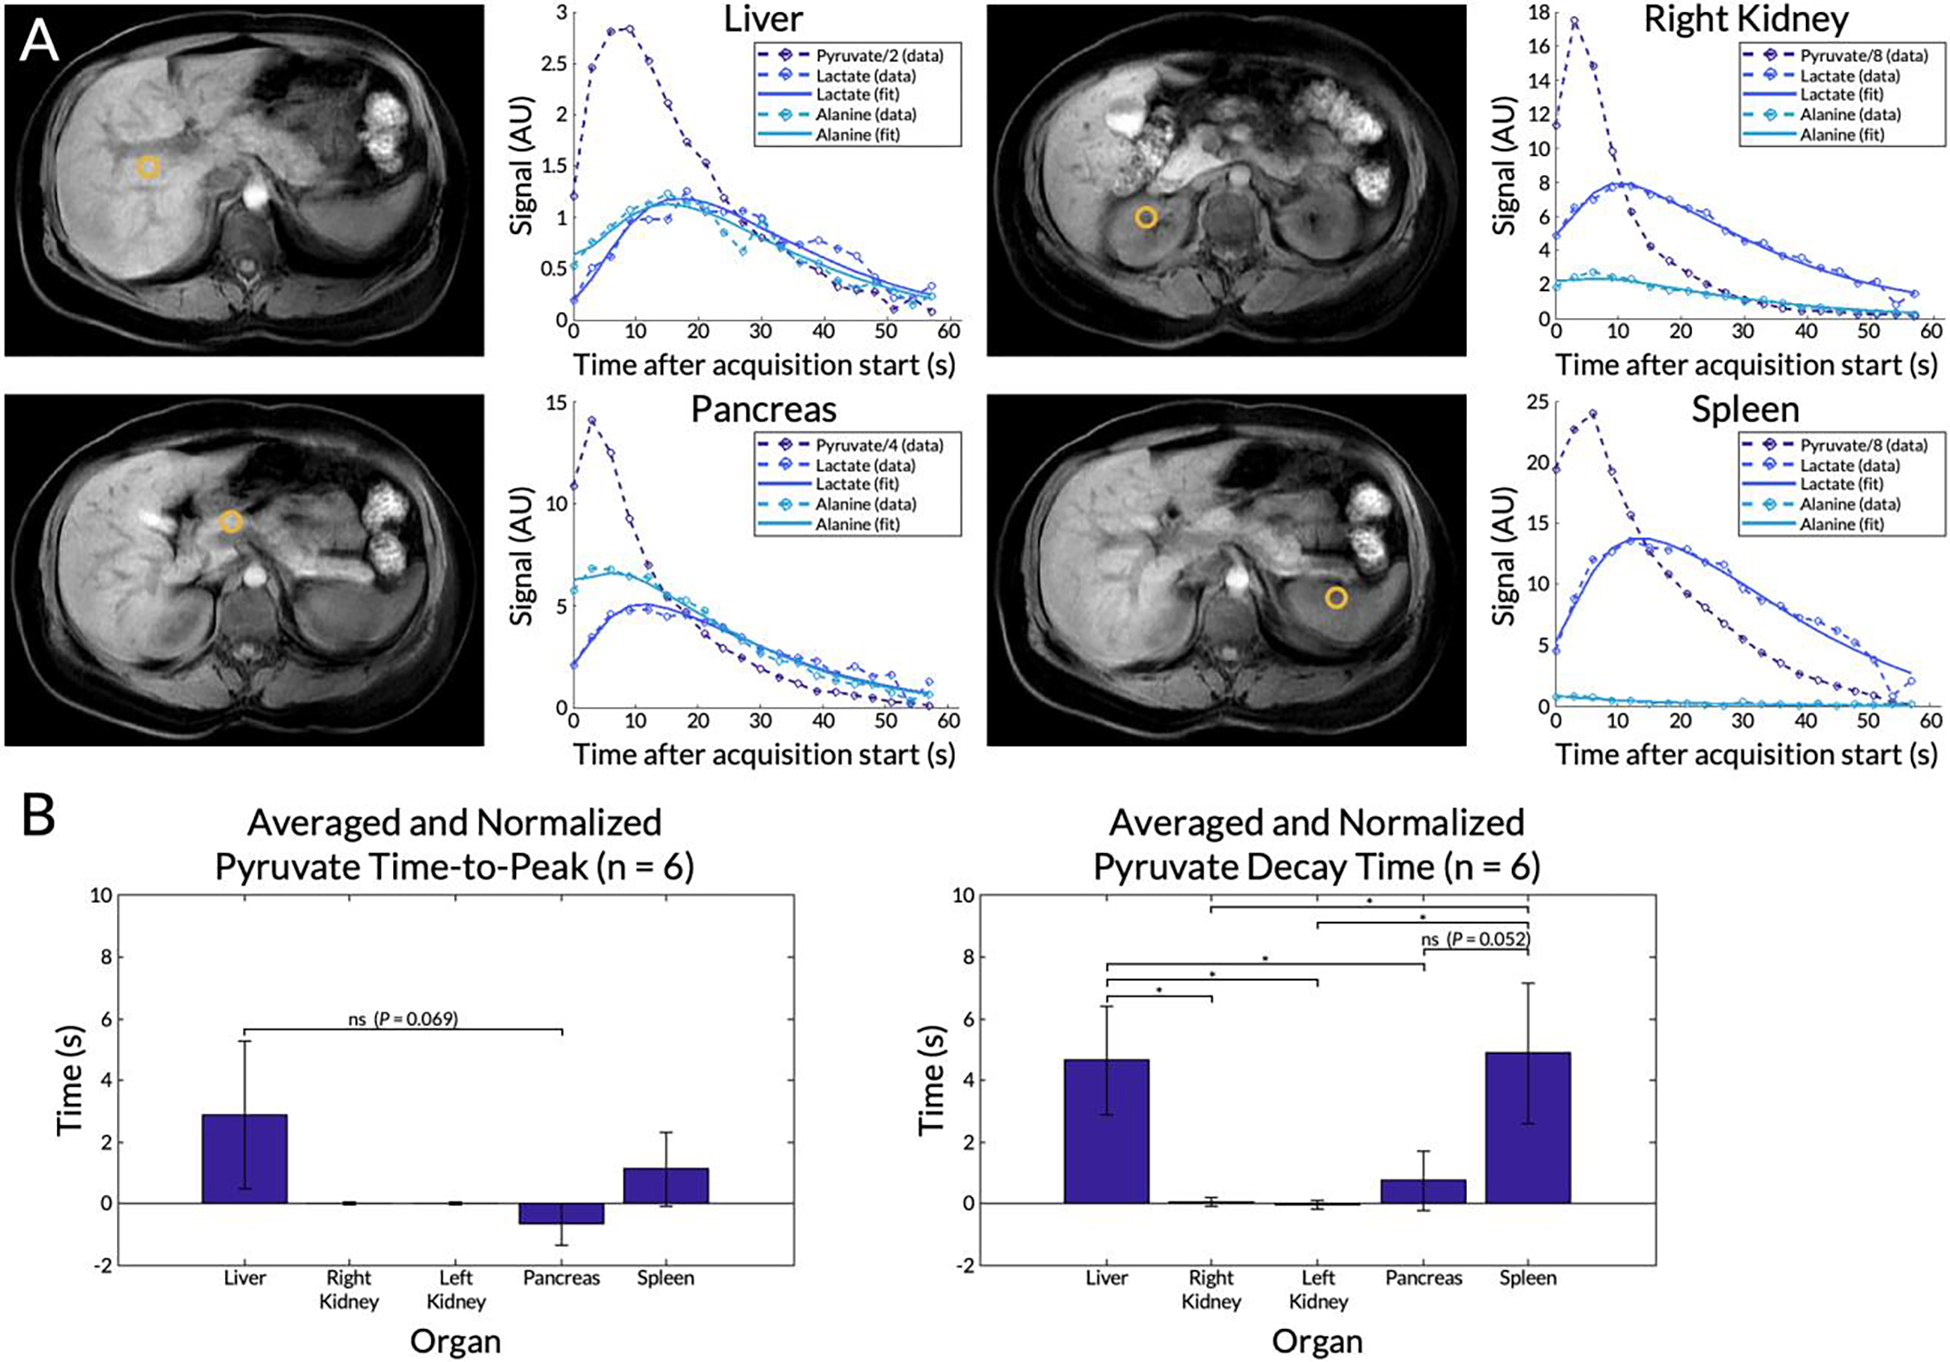
(A) Dynamic curves for each metabolite from a selected voxel in the liver, right kidney, pancreas, and spleen from a representative EPI scan. Locations of the voxels are shown in the corresponding T1-weighted anatomical images. Measured signals (circles and dashed lines) are shown together with curve fits computed using an inputless two-site exchange model (solid lines). The pyruvate signals were scaled for display. (B) Mean pyruvate time-to-peak and decay time for each organ averaged across six subjects with EPI scans (subject #9 was excluded). Error bars indicate standard deviations. A single asterisk * denotes statistical signiifcance, while “ns” denotes not statistically significant. Unlabeled comparisons were also not statistically significant.