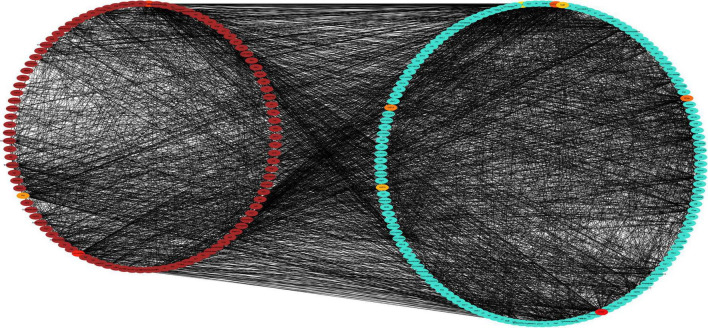
FIGURE 10.
Protein-Protein Interaction network analysis of drought-responsive modules. PPI networks of the positively correlated brown module and the negatively correlated turquoise module were visualized using the Cytoscape software platform. The correlation networks of the top 10 genes and their directly regulatory genes from brown and turquoise modules were clustered into two circles. The color depth of 10 hub genes represents the strength of connectivity.

