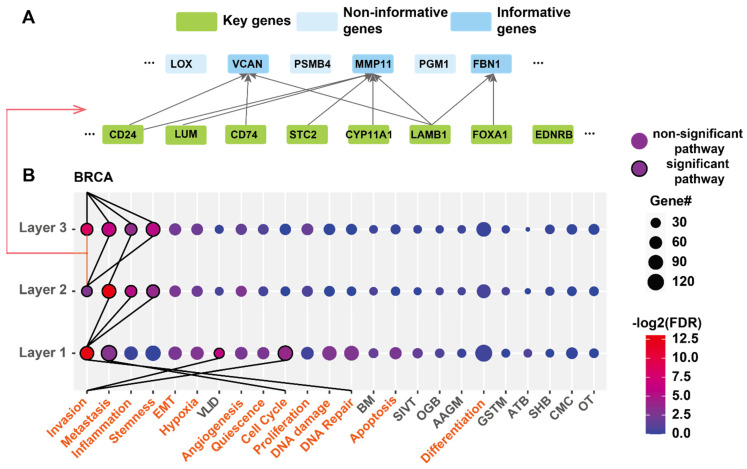
Figure 3.
Functions of T-GEM each layer for cancer type classification. A. snapshot of layer 3 after thresholding the weight attribution scores. The links are associated with scores larger than the threshold. Query genes with no links are non-informative genes. (B) Enriched functions of each layer for the classification of breast cancer (BRCA). (A) link connects an enriched pathway with a pathway in the previous layer if this pathway’s informative gene-associated Key genes are enriched the pathway at the previous layer. The size of the dots represents the number of enriched informative genes in each pathway genesets, and the color shows the enrichment significance (FDR). FDR is negative log2 transferred, red means more significantly enriched, and blue means less enriched. The genesets from cancer states are marked as orange, and genesets from KEGG pathway are black. The pathway is ranked based on the sum of −log2(FDR) for all 3 layers. Abbr. VLID (VALINE_LEUCINE_AND_ISOLEUCINE_DEGRADATION); BM (BUTANOATE_METABOLISM); SIVT(SNARE_INTERACTIONS_IN_VESICULAR_TRANSPORT); OGB (O_GLYCAN_BIOSYNTHESIS); AAGM(ALANINE_ASPARTATE_AND_GLUTAMATE_METABOLISM); GSTM (GLYCINE_SERINE_AND_THREONINE_METABOLISM); ATB(AMINOACYL_TRNA_BIOSYNTHESIS) SHB (STEROID_HORMONE_BIOSYNTHESIS); CMC(CARDIAC_MUSCLE_CONTRACTION); OT(OLFACTORY_TRANSDUCTION).

