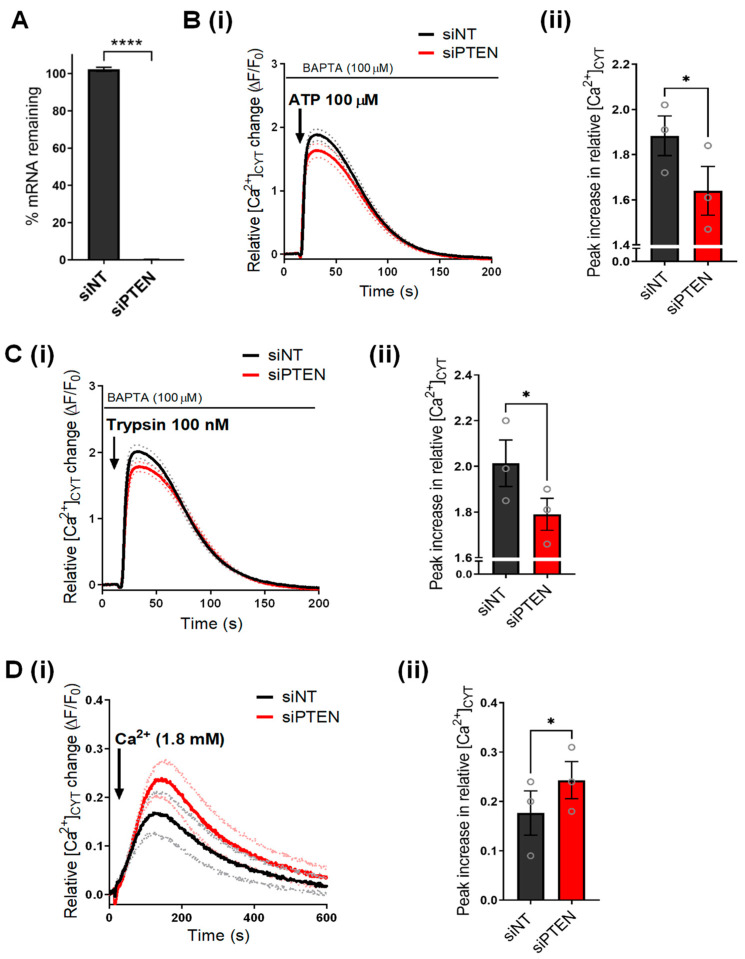
Figure 1.
PTEN silencing remodels Ca2+ signaling in GCaMP6m-MDA-MB-231 cells. (A) Bar graph shows percent mRNA remaining in PTEN silenced (siPTEN) cells compared to NT control (siNT). Traces (i) show the mean relative [Ca2+]CYT increases in GCaMP6m-MDA-MB-231 cells as a result of (B) ATP 100 µM, (C) trypsin 100 nM or (D) CaCl2 (1.8 mM) addition to siNT or siPTEN-treated GCaMP6m-MDA-MB-231 cells. Dotted lines on the traces represent the S.E.M of the mean F/F0 of three biological replicates. Bar graphs compare the (ii) maximal or peak relative increase in [Ca2+]CYT between siNT and siPTEN transfected cells. Data represent the mean ± S.E.M. (n = 3) and were analyzed using a paired t-test. **** < p < 0.0001, * p < 0.05.

