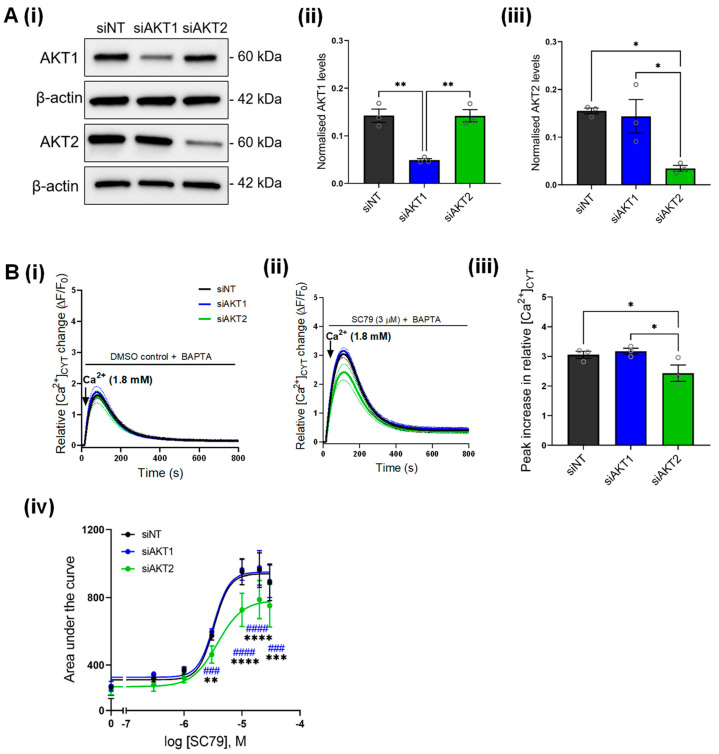
Figure 3.
Effect of AKT1 and AKT2 silencing on SC79-mediated Ca2+ influx. (A) (i) Immunoblot shows the protein levels of AKT1 and AKT2 with siAKT1 and siAKT2 compared to siNT control. Bar graphs show the densitometry analysis of (ii) AKT1 and (iii) AKT2 protein levels as a result of siAKT1 and siAKT2 treatment in GCaMP6m-MDA-MB-231 cells. Statistical analyses were done using a one-way ANOVA with Bonferroni’s test. ** p < 0.01, * p < 0.05. (B) Traces show the effect of AKT1 (siAKT1) and AKT2 (siAKT2) silencing on (i) basal Ca2+ influx and (ii) SC79-mediated Ca2+ influx (3 µM) in GCaMP6m-MDA-MB-231 cells. (iii) Bar graph show the mean ± S.E.M. of the peak relative Ca2+ increase induced by SC79 (3 µM) in cells transfected with siAKT1 and siAKT2 compared to siNT. Statistical analysis was performed using a one-way ANOVA with Bonferroni’s test. * p < 0.05. (iv) Concentration-response curve comparing the effect of siAKT1 and siAKT2 on area under curve as a result of SC79-mediated Ca2+ influx. Data points on the curves were normalized to the DMSO control for each biological replicate. Statistical analysis was performed using a repeated measures two-way ANOVA with Bonferroni’s test. * denotes statistical difference between siAKT2 and siNT; # denotes statistical difference between siAKT1 and siAKT2. **** p < 0.0001; *** p < 0.001, ** p < 0.01. Uncropped Western blots in Figure S4.

