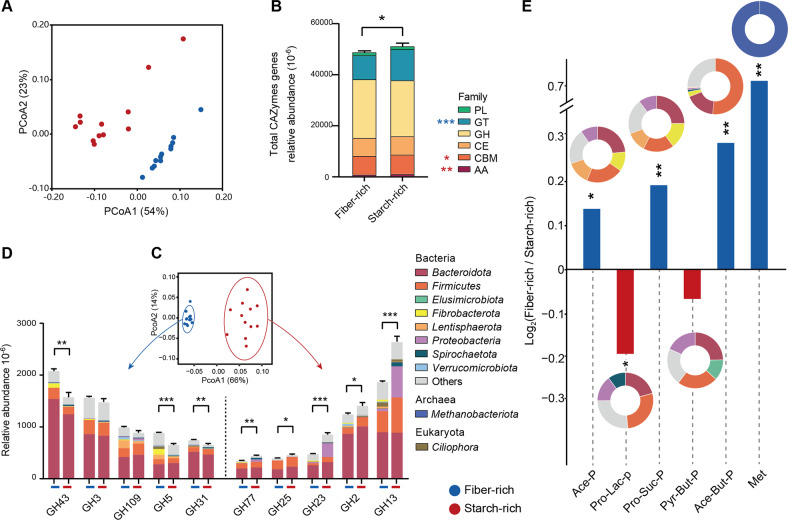
Fig. 3. Fiber-rich and starch-rich treatment exhibits distinct genes of CAZymes and KEGG enzymes enriched in rumen microbiome.
A PCoA profile of all KO genes (PERMANOVA, P < 0.001, R2 = 0.70); B relative abundance of total of CAZymes genes; C PCoA profile of the GH family (PERMANOVA, P < 0.001, R2 = 0.64); D gene abundance of the top five GH family enzymes, and their phylogenetic distribution enriched per phylum (AA auxiliary activity, CBM carbohydrate-binding module, CE carbohydrate esterase, GH glycoside hydrolase, GT glycosyltransferase, PL polysaccharide lyase); E acetate, butyrate, propionate and methanogenesis pathways of KEGG enzymes expressed as ratios of alignments of fiber-rich versus starch-rich treatment (log2 ratio); and pie charts show the phylogenetic distribution of the pathways enriched in each treatment at phylum. Ace-P acetate production pathway, Pyr-But-P pyruvate to butyrate production pathway, Ace-But-P acetate to butyrate production pathway, Pro-Lac-P propionate (lactate) pathway, Pro-Suc-P propionate (succinate) pathway, Met methanogenesis pathway. All KO genes in enriched pathways were assigned to the identified phylum. Details of all KO genes together with identified genus and pathways are in additional files S4 and S5. Significance was tested using independent two-group Wilcoxon rank-sum tests. Data with error bars are expressed as mean ± standard error. Asterisks denote significant adjusted p values: **p < 0.01, ***p < 0.001, n = 12/group.

