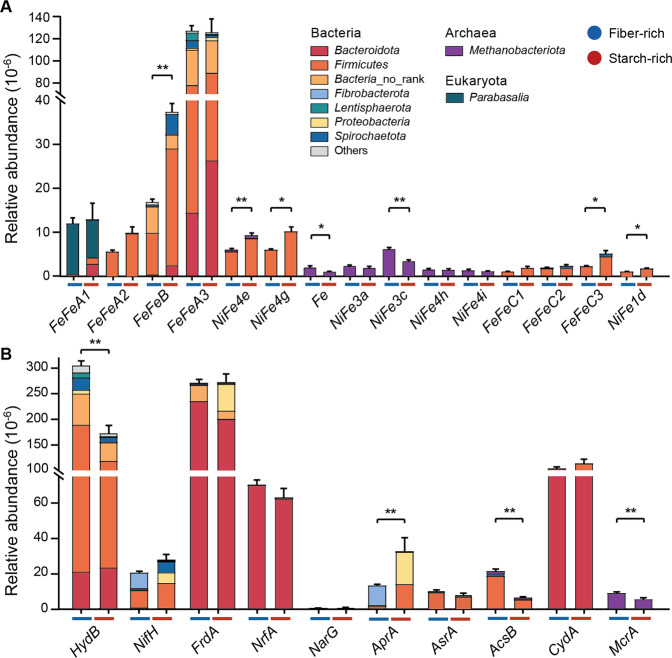
Fig. 4. Fiber-rich and starch-rich treatment resulted in different hydrogenase and terminal reductases level in rumen microbiome.
A Hydrogenase genes distributions assigned by phylum; B genes of associated terminal reductases distributions assigned by phylum. Fermentative hydrogenases (group B, A1 and A2 FeFe-hydrogenases), electron-bifurcating hydrogenases (group A3 and A4 FeFe-hydrogenases), energy-converting hydrogenases (bidirectional; group 4a, 4c, 4d, 4e, 4f and 4g NiFe-hydrogenases), methanogenic hydrogenases (Fe-hydrogenases, group 3a, 3c, 4h, 4i and 1k NiFe-hydrogenases), respiratory hydrogenases (group 1a, 1b, 1c, 1d, 1k, 2a), sensory hydrogenases (group C FeFe-hydrogenases). HydB hydrogenase-associated diaphorase. NifH nitrogenase. H2 uptake pathways can be coupled to fumarate reduction (FrdA fumarate reductase), nitrate ammonification (NrfA, ammonia-forming nitrite reductase; NarG, dissimilatory nitrate reductase; NapA, periplasmic nitrate reductase), sulfate and sulfite reduction (AprA adenylylsulfate reductase; AsrA alternative sulfite reductase; DsrA, dissimilatory sulfite reductase), dimethyl sulfoxide and trimethylamine N-oxide reduction (DmsA DMSO and TMAO reductase), reductive acetogenesis (AcsB, acetyl-CoA synthase), aerobic respiration (CydA cytochrome bd oxidase), and methanogenesis (McrA methyl-CoM reductase). No rank means there is no specific taxonomic information at the phylum level. Only genes of average relative abundance > 1 were shown, while other were shown in additional file S6. Significance was tested using independent two-group Wilcoxon rank-sum tests. Data with error bars are expressed as mean ± standard error. **p < 0.01, ***p < 0.001, n = 12/group.

