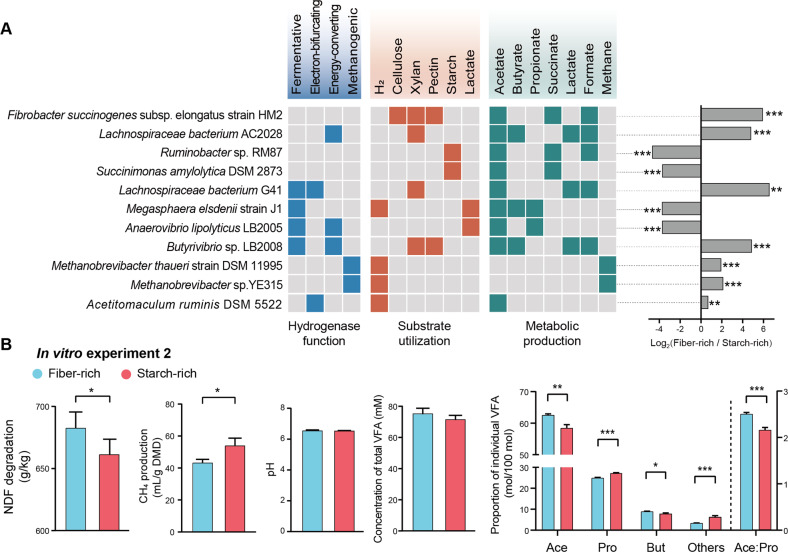
Fig. 5. Metabolic features enriched in microbiome of fiber-rich and starch-rich diets in relation to function.
A metabolic features of representative microorganisms. Reads from each sample were aligned to sequenced genomes of cultured rumen microorganisms in the Hungate1000 collection using the burrows-wheeler alignment tool. The hydrogenase function, substrate utilization, and metabolite production of each microorganism based on the known growth characteristics [5, 30] are colored in blue, orange, and green, respectively. The ratios between alignments of fiber-rich/starch-rich samples to each genome are presented, and data were expressed as log2 (ratio). Genomes attributes: fibrolytic bacteria, Fibrobacter succinogenes subsp. elongatus strain HM2 and Lachnospiraceae bacterium AC2028; amylolytic bacteria, Ruminobacter sp. RM87 and Succinimonas amylolytica DSM 2873; acetate producer, Lachnospiraceae bacterium G41 and Fibrobacter succinogenes subsp elongatus strain HM2; butyrate producer, Lachnospiraceae bacterium AC2028 and Butyrivibrio sp. LB2008; lactate utilizer and propionate producer, Megasphaera elsdenii strain J1 and Anaerovibrio lipolyticus LB2005; hydrogenotrophic methanogen, Methanobrevibacter thaueri strains DSM 11995 and sp. YE315; acetogens, Acetitomaculum ruminis DSM 5522. Detailed information of other genomes is shown in additional file S7; B methane (CH4) production, neutral detergent fiber (NDF) degradation, pH and volatile fatty acid (VFA) profile of in vitro rumen experiment 2 with rice straw fermentation by inoculating fiber-rich or starch-rich selected microbiome. Data with error bars are expressed as mean ± standard error. **p < 0.01, ***p < 0.001, n = 12/group.

