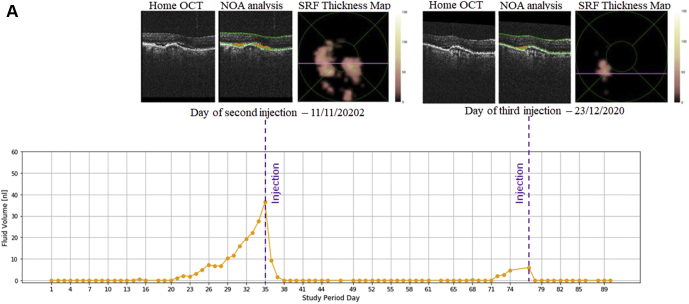
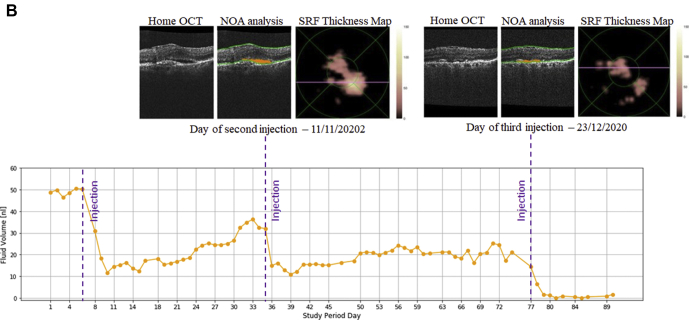
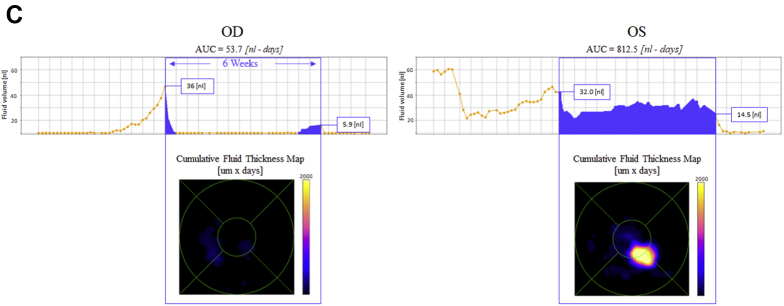
Figure 5.
Retinal fluid volume-time curves for study participant 5. A, Right eye: subretinal fluid (SRF) volume-time curve from Notal OCT Analyzer (NOA) segmentation of daily home OCT self-images. The eye received an intravitreal anti–VEGF injection of ranibizumab 6 weeks before the beginning of the study period. No SRF was identified during the first 3 weeks of the study period. This was followed by the appearance of SRF that increased in volume over 2 weeks, from 0 to 36 nl, first slowly and then more rapidly. After an intravitreal anti-VEGF injection of ranibizumab at this point, the volume of SRF decreased rapidly to 0 over 3 days. The SRF remained absent over the next 5 weeks. Again, this was followed by the appearance of SRF that increased in volume over 5 days, from 0 to 6 nl. As before, after an intravitreal anti-VEGF injection of ranibizumab, the SRF volume decreased rapidly to 0 over 1 day and remained absent until the end of the study period. Also shown are the NOA SRF segmentation (orange) and the NOA SRF thickness maps from 2 time points, at the time of each anti-VEGF injection, when SRF volume was greatest. B, Left eye: SRF volume-time curve from NOA segmentation of daily home OCT self-images. The eye received an intravitreal anti-VEGF injection of bevacizumab 4 weeks before the beginning of the study period. The SRF was present at a volume of approximately 50 nl during the first 5 days of the study period. After an intravitreal anti-VEGF injection of ranibizumab at this point, the SRF volume decreased rapidly over 3 days to a minimum of 11 nl. The volume of SRF increased slowly and gradually over the next 25 days, from 11 to approximately 32 nl. Again, after an intravitreal anti-VEGF injection of ranibizumab, the SRF volume decreased rapidly over 4 days to a minimum of 11 nl. The volume of SRF increased very slowly and gradually over the next 5 weeks, much more slowly than before, from 11 to approximately 20 nl. After another intravitreal anti-VEGF injection of ranibizumab, the SRF volume decreased rapidly over 4 days, this time to the point of complete resolution, before the end of the study period. Also shown are the NOA SRF segmentation (orange) and the NOA SRF thickness maps from 2 time points, at the time of each anti-VEGF injection. C, Comparison of retinal fluid volume-time curves for the right eye (OD) and left eye (OS). Representative examples of the cumulative retinal fluid load metric represented by area under the receiver operating characteristic curve (AUC; shown in blue). Despite relatively similar fluid volumes at the individual time points of anti-VEGF injection days, the AUC of cumulative retinal fluid load in the intervening period between 2 retinal clinic visits differed very substantially between the 2 eyes of the same participant (53.7 nl-days vs. 812.5 nl-days). Without frequent home OCT imaging, this large difference would remain hidden and might account for differential visual and anatomic outcomes over time.


