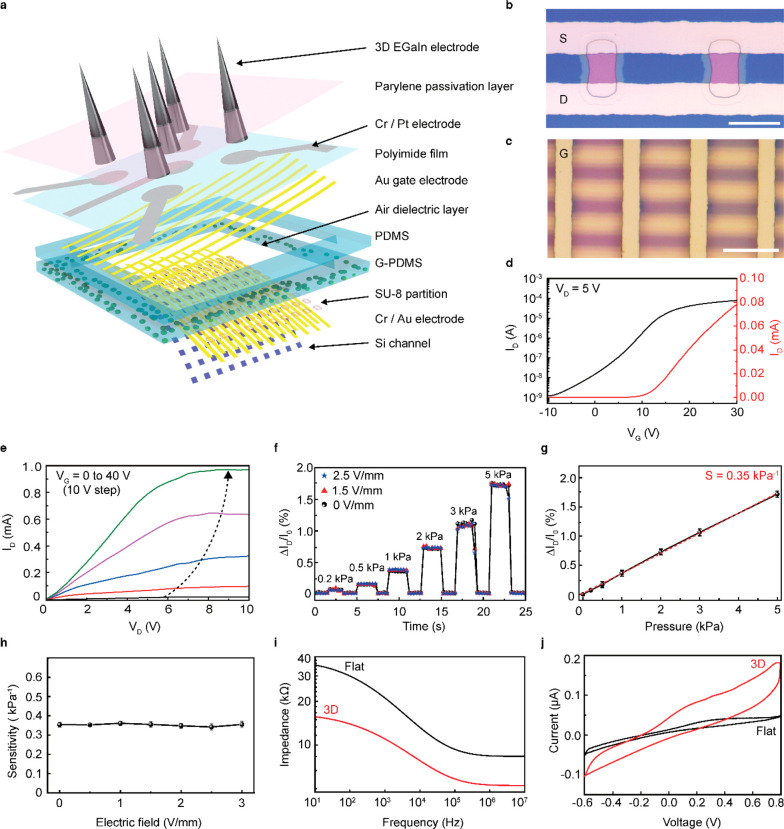
Figure 2.
Characterization of the multimodal sensing device for cardiac organoid detection. (a) Schematic layouts of the multimodal sensor that is composed of an active-matrix pressure-sensitive transistor array with integrated soft liquid-metal electrodes. (b) Optical micrograph of the two adjacent transistors. S and D denote the source electrode and drain electrode, respectively. Scale bar, 20 μm. (c) Optical micrograph after the gate electrode (denoted as G) assembly. Scale bar, 50 μm. (d) Representative transfer characteristics of Si FET (VD = 5 V) of the device at ambient conditions. (e) Output characteristic of an air-dielectric FET (VG = 0 to 40 V, 10 V step) at ambient conditions. (f) Real-time measurements of normalized ID changes for the applied compressive pressures during electrical stimulation at different electrical fields (VG = 20 V, VD = 5 V). (g) Plot of the relative changes in ID versus applied compressive pressure to define pressure sensitivity (denoted as S). Error bars indicate the standard deviations. (h) Plot of the pressure sensitivity versus the different magnitudes of the electric field. (i) Impedance of the 3D EGaIn electrode (height, 250 μm; diameter, 60 μm; red line) and flat electrode (black line) over the frequency range from 10 Hz to 10 MHz. (j) Cyclic voltammetry plot of 3D EGaIn electrode (height, 250 μm; diameter, 60 μm; red line) and flat electrode (black line) over a range from −0.6 to 0.8 V at a sweep rate of 50 mV s–1.

