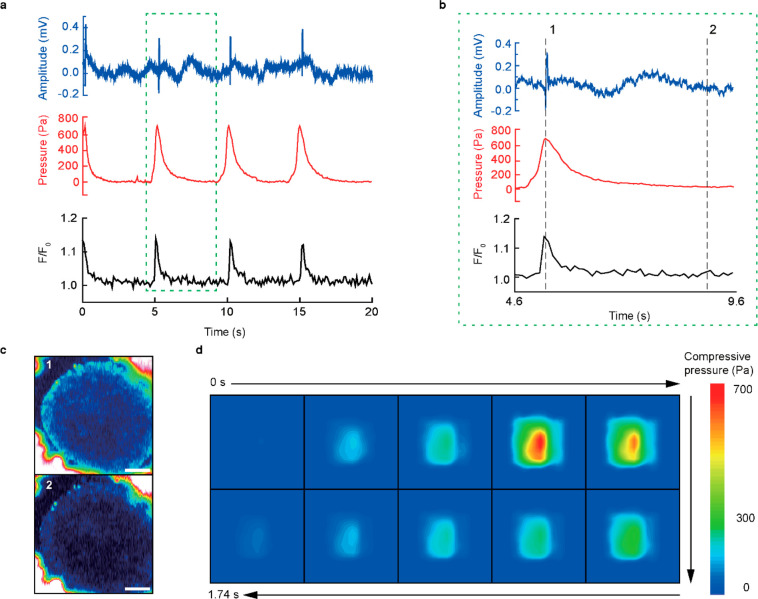
Figure 4.
Multimodal characterization of cardiac organoids. (a) Real-time characterization plot of the ECG amplitude (blue), compressive pressure (red), and normalized fluorescence intensity (black) of the hiPSC-derived cardiac organoid by the multimodal characterization device. (b) Magnified plot of multimodal characterization data versus time which defines one beating cycle of the cardiac organoid, denoted as the green dotted box in (a). (c) Pseudocolor fluorescence images of the cardiac organoid at the instance of depolarization (top), labeled as time frame 1 in (b) and 3.8 s afterward (bottom) labeled as time frame 2 in (b). Scale bar, 100 μm. (d) Time-lapsed spatiotemporal color maps of compressive pressure distribution of the hiPSC-derived cardiac organoid to capture the instances of movement during a single beating. Each motion frame of the cardiac organoid was taken every 174 ms.

