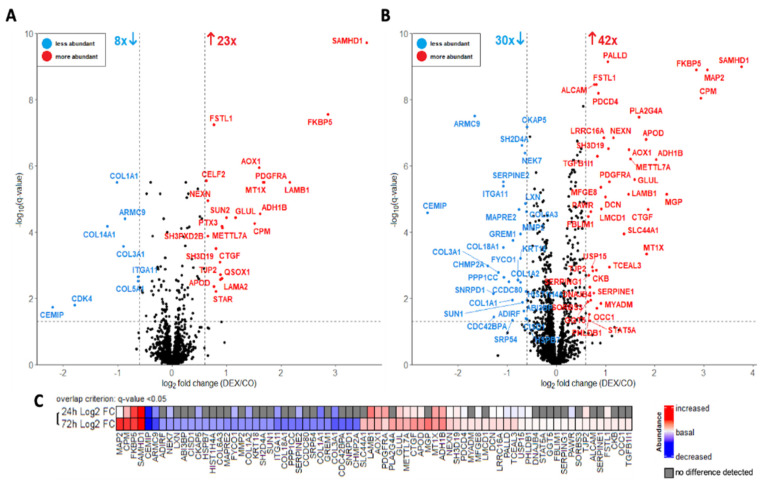
Figure 3.
Volcano plot analysis of cellular proteomes treated with 1 µM dexamethasone for 24 h (A) and 72 h (B). The data was analyzed with a paired Student’s t-test; false-discovery rate (FDR): 0.05. Each colored dot represents a protein fulfilling the significance criteria (q-value < 0.05, log2 fold change >|0.6|): blue–proteins less abundant in the treated group; red–proteins more abundant in the treated group. For selected significant hits, gene names are displayed. (C) = log2 fold changes of significantly differentially abundant proteins of the 24 h-treatment and 72 h-treatment datasets. For the overlap, the 72 proteins (fulfilling the above significance criteria) from 72 h dataset were used as “base”. This was overlayed by the proteins from the 24 h dataset fulfilling only the “overlap criterion” of q-value < 0.05, which additionally includes potential trends, given the lower size of this dataset.

