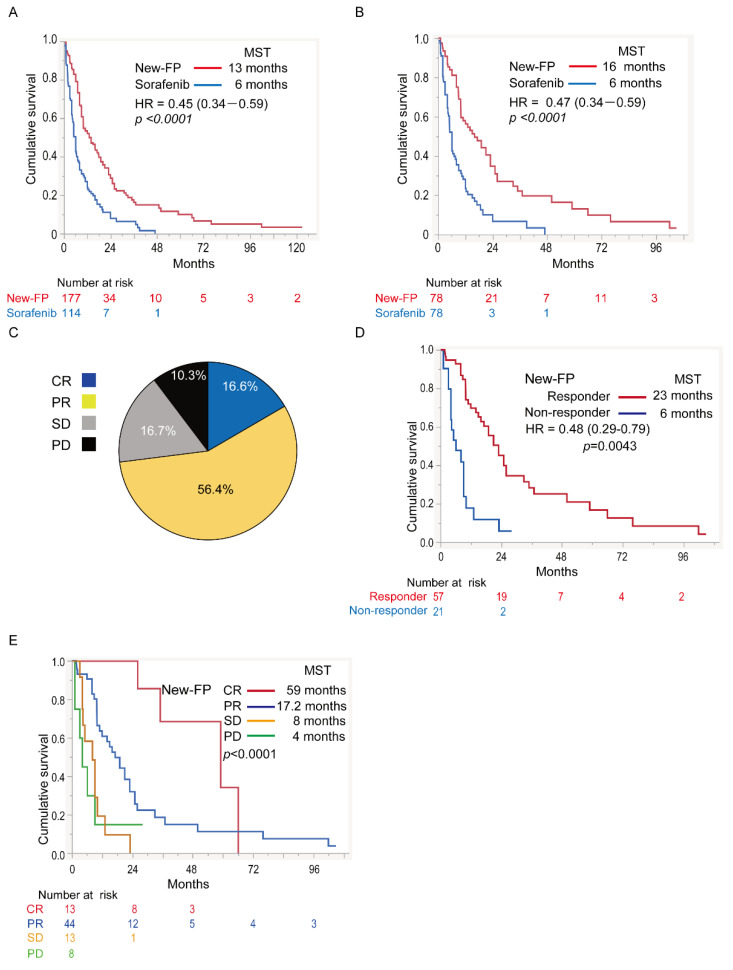
Figure 3.
Therapeutic effects of New-FP and sorafenib in HCC with major PVTT. (A) Cohort 5, survival curves of patients with major PVTT-HCC before propensity score matching: New-FP (n = 177, blue line) and sorafenib (n = 114, red line). (B) Cohort 5, survival curves of patients with major PVTT-HCC after propensity score matching: New-FP (n = 78, blue line) and sorafenib (n = 78, red line). (C) Therapeutic response for New-FP in major PVTT-HCC. (D) Survival curves in the responder (red line, n = 57) and non-responder groups (blue line, n = 21) for New-FP. (E) Survival curves in different therapeutic response groups for New-FP: CR (red line, n = 13), PR (blue line, n = 44), SD (yellow line, n = 13), and PD (green line, n = 8). CR, complete response; HCC, hepatocellular carcinoma; HR, hazard ratio; MST, median survival time; PD, progressive disease; PR, partial response; PVTT, portal vein tumor thrombus; SD, stable disease.

