Figure 1.
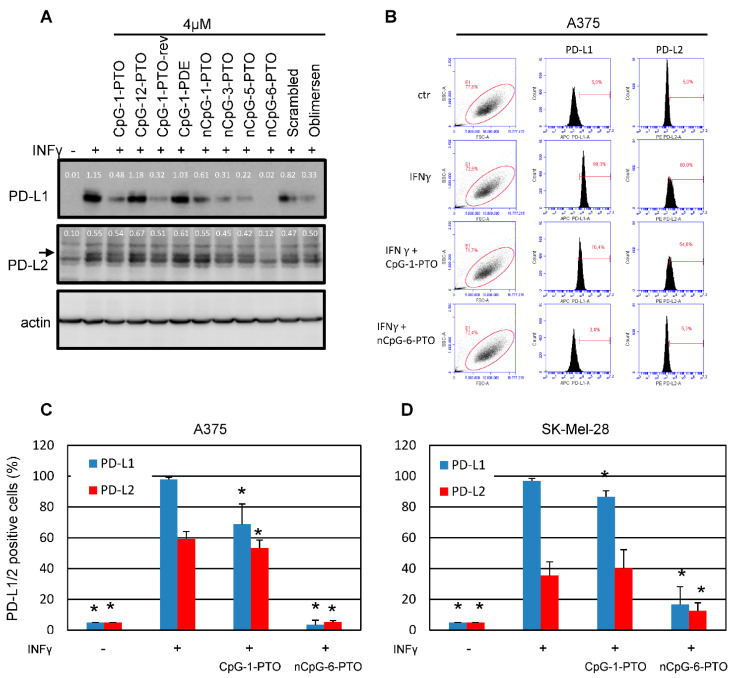
Oligonucleotides suppress the protein expression of PD-L1 and PD-L2. (A) A375 melanoma cells prestimulated for 1 h with IFNγ (20 ng/mL) were exposed to different oligonucleotides (4 µM). Oligo characteristics in regard to backbone and sequence are given in Table 1. After 24 h, total protein was extracted and separated by SDS-PAGE. The blotted proteins were probed with anti-PD-L1 and anti-PD-L2. Probing with anti-beta actin served as loading control. The images show representative results. (B) Exemplary result of a FACS scan against PD-L1 and PD-L2 after treatment with 4 µM CpG-1-PTO and 4 µM nCpG-6-PTO in A375 cells. Summary of 9 independent FACS experiments using (C) A375 and (D) SK-Mel-28 cells treated with 4 µM CpG-1-PTO or nCpG-6-PTO. The standard deviations are indicated. Data were related to the referring positive control (IFNγ). * p < 0.05.

