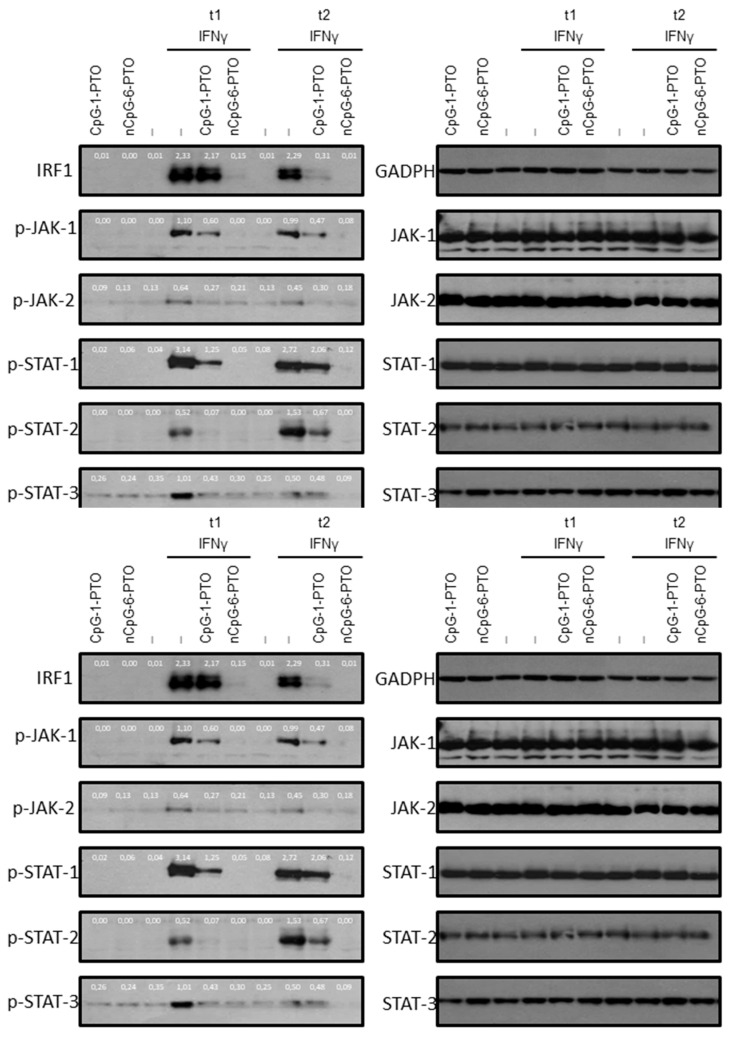
Figure 5.
Western blot analysis of interferon receptor signaling proteins. A375 cells were treated with 4 µM CpG-1-PTO or 4 µM nCpG-6-PTO without further stimulation (basal activation, row 1–3) or with additional stimulation with IFNγ for two time periods (t1 and t2). Protein extracts were subjected to Western blot analysis and tested for expression of IRF1 (t1: 60 min, t2: 3 h), p-JAK-1 (t1: 10 min; t2: 30 min), p-JAK-2 (t1: 10 min; t2: 30 min), p-STAT-1 (t1: 10 min; t2: 30 min), p-STAT-2 (t1: 10 min; t2: 30 min) and p-STAT-3 (t1: 10 min; t2: 30 min). Equal loading was monitored using antibodies directed against the total form of the phospho-protein, or in the case of IRF1 by GAPDH (blots on the right). The blots show representative results (n = 3). p-: phospho.

