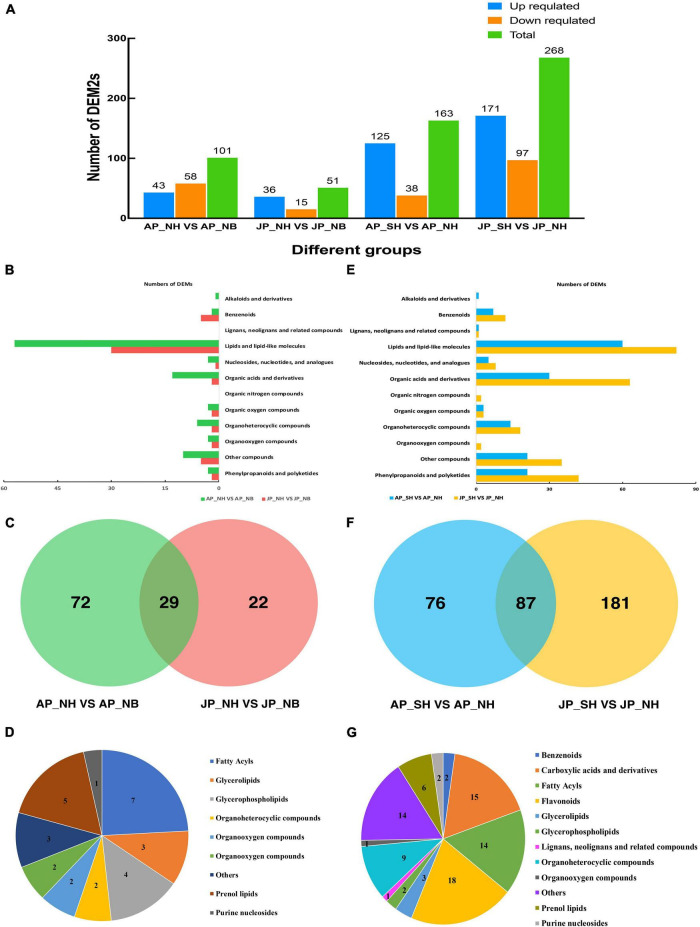
FIGURE 3.
Analysis of differentially expressed metabolites. (A) Number of DEMs in different comparison groups. (B) The type and quantity of differential metabolites in NH and NB comparison groups under two environments. (C) Venn diagram of differential cumulative metabolites in NH and NB comparison group. (D) Types and quantities of differential metabolites shared by NH and NB comparison groups. (E) The type and quantity of differential metabolites in SH and NH comparison groups under two environments. (F) Venn diagram of differential cumulative metabolites in SH and NH comparison group. (G) Types and quantities of differential metabolites shared by SH and NH comparison groups.

