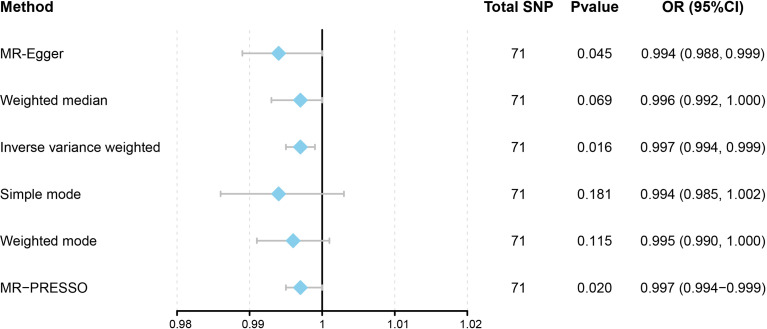
Figure 2.
Forest plot to visualize causal effects of variation in Hypothyroidism on HCC. Presented odds ratios (OR) and confidence intervals (CI) correspond to the effects of Hypothyroidism on HCC. The results of Mendelian Randomization (MR) analyses using various analysis methods (MR-Egger, Weighted median, Inverse variance weighted, Simple mode, and Weighted mode) are presented for comparison. Total single-nucleotide polymorphism (SNP) indicates the number of genetic variants used as instruments for MR analysis.

