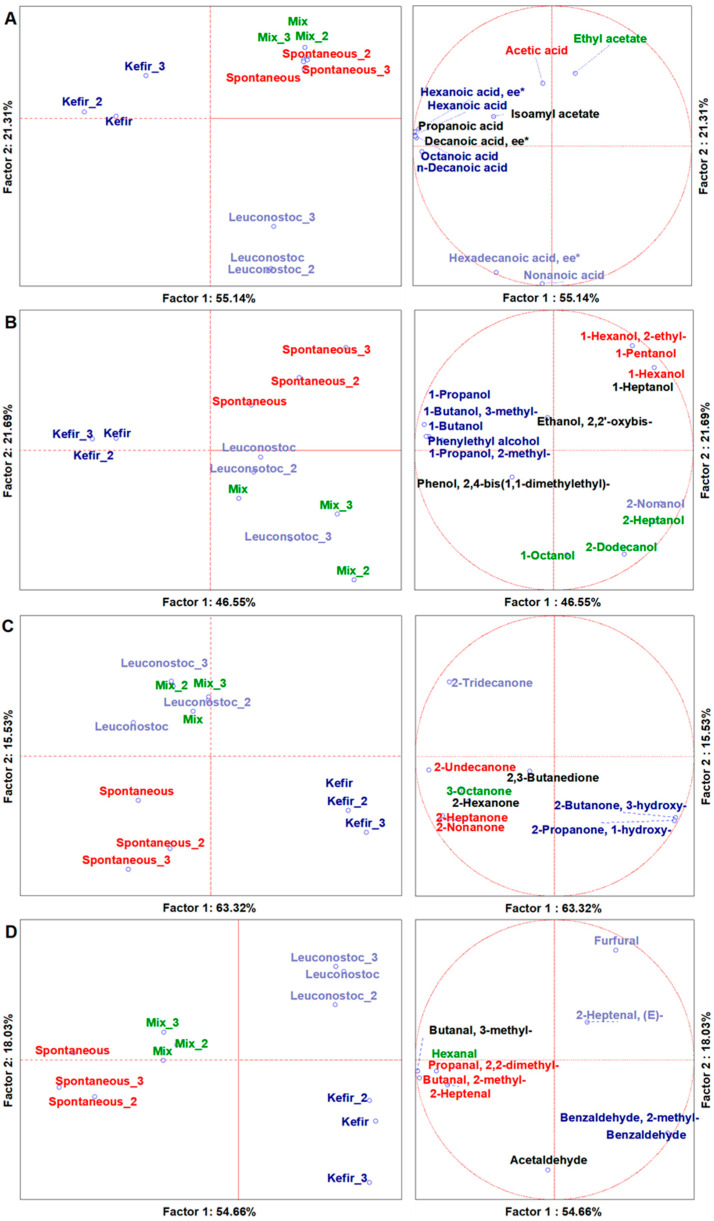
Figure 1.
PCAs of the volatilome sorted by chemical classes of significative (ANOVA p < 0.05) VOCs. (A)—organic acids; (B)—alcohols; (C)—ketones; (D)—aldehydes. Left-side diagrams are for PCAs of cases, while right-side diagrams are for PCAs of variables. * ee—ethyl ester; _2 and _3 indicate the mean of technical replicas of experimental replicates. Mix—sample fermented after LAB mix starter addition; Spontaneous—sample fermented with spontaneous micro-organisms; Leuconostoc—sample fermented after L. mesenteroides starter addition; Kefir—sample fermented after water kefir starter addition.

