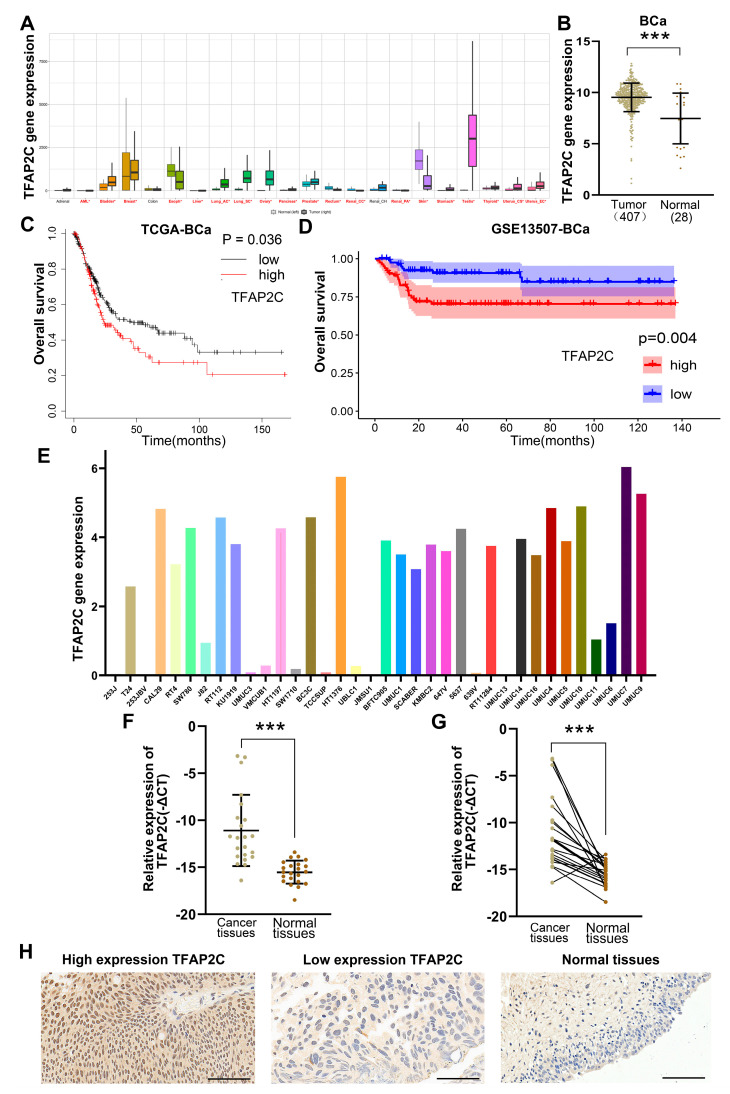
Figure 1.
TFAP2C expression analysis and cancer prognosis. (A) The expression of TFAP2C in pan − carcinoma tissues. Tumor names marked in red represent significant differences. (B) TFAP2C expression in tumor and normal tissues in TCGA − BLCA dataset and GTEx datasets. (C,D) Kaplan − Meier plot curves of the TCGA − BLCA dataset (C) and GSE dataset (GSE13507) (D). (E) The expression of TFAP2C in 36 BCa cell lines. (F,G) qRT − PCR was performed to measure TFAP2C mRNA expression levels in 22 pairs of BCa and adjacent normal tissues. TFAP2C expression was significantly upregulated in BCa tissues compared with adjacent normal tissues. (H) Representative immunohistochemistry of TFAP2C in BCa tissues and adjacent tissues. Scale bars, 100 μm. (*** p < 0.001).

