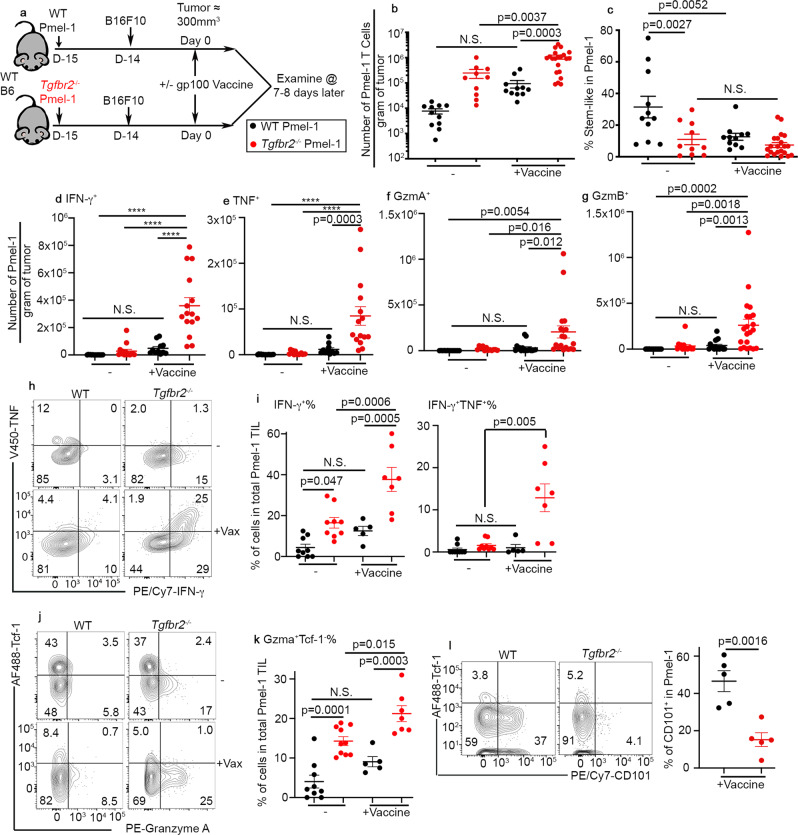
Fig. 2. Increased accumulation of Tgfbr2−/− effector CD8+ T cells inside tumor after vaccination.
a Experimental design. Black symbols, WT and red symbols, Tgfbr2−/−. b The number of Pmel-1 T cells per gram of tumor is shown. c The percentage of stem-like subset in Pmel-1 T cells isolated from tumor is shown. For b and c, WT, n = 11, Tgfbr2−/−, n = 10, WT + Vaccine, n = 11 and Tgfbr2−/−+Vaccine, n = 21. Per gram of tumor, the numbers of Pmel-1 T cells producing IFN-γ (d), TNF (e), Granzyme A (f), and Granzyme B (g) are shown. For d and e, WT, n = 15, Tgfbr2−/−, n = 14, WT + Vaccine, n = 11 and Tgfbr2−/−+Vaccine, n = 15. For f, WT, n = 13, Tgfbr2−/−, n = 12, WT + Vaccine, n = 17 and Tgfbr2−/−+Vaccine, n = 19. For g, WT, n = 15, Tgfbr2−/−, n = 14, WT + Vaccine, n = 17 and Tgfbr2−/−+Vaccine, n = 21. h Representative FACS profiles of TIL Pmel-1 T cells are shown. i The percentage of IFN-γ+ (left) and IFN-γ+TNF+ TIL Pmel-1 T cells are shown. WT, n = 9, Tgfbr2−/−, n = 9, WT + Vaccine, n = 5 and Tgfbr2−/−+Vaccine, n = 7. Representative FACS (j) and the percentage of Granzyme A+Tcf-1− effector T cells in TIL Pmel-1 (k) are shown. WT, n = 9, Tgfbr2−/−, n = 10, WT + Vaccine, n = 5 and Tgfbr2−/−+Vaccine, n = 7. l Left, representative FACS profiles of pre-gated donor Pmel-1 T cells isolated from tumor are shown; Right, the percentage of CD101+ subset in Pmel-1 T cells is shown. N = 5/each group. Each symbol represents the results from an individual mouse. 2–3 independent repeats. Data are presented as mean ± SEM. N.S., not significant (p > 0.05), ****p < 0.0001 and indicated p values are calculated by unpaired Student t-test (l) or Ordinary one-way ANOVA with multi-comparison posttest (b–k). Two-sided tests were used. Source data are provided as a Source data file.

