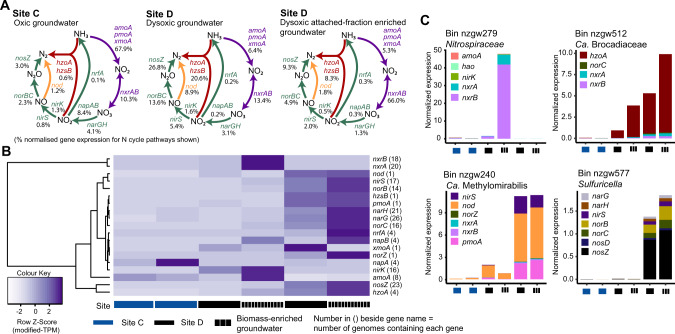
Fig. 2. Nitrogen-cycling gene transcription at site C groundwater and site D groundwater and attached-fraction enriched groundwater.
A Nitrogen cycle schematics display the average abundance of nitrogen-cycling transcripts (based on modified-TPM values) per site and sample type (relative to nitrogen-cycling pathways overall (as shown). The percentage of gene transcripts associated with each pathway component is shown in black font. Coloured arrows represent pathways (purple = nitrification, green = denitrification and red = anammox). Only NrfA and not NirBD are shown for the DNRA pathway. B Heatmap shows nitrogen-cycling modified transcripts per million (modified-TPM) at each site (ordered gwj9, gwj11, gwj13-gwj16), scaled by row (Z-Score). Solid coloured blocks represent groundwater, black grid blocks represent the attached-fraction (or biomass) enriched groundwater. C Stacked bar plots display four active nitrogen-cycling genomes and the relative abundance (modified-TPM normalized to genome coverage) of their nitrogen-cycling gene transcripts across each site. Abbreviations: amo ammonia monooxygenase, pmo particulate methane monooxygenase, xmo copper-containing membrane monooxygenase, nod nitric oxide dismutase, nxr nitrite oxidoreductase, nar nitrate reductase (dissimilatory), nap periplasmic nitrate reductase, nirK copper-containing nitrite reductase, nirS cytochrome cd1-containing nitrite reductase, nor nitric oxide reductase, nos nitrous oxide reductase, nrf nitrate reductase, hzo hydrazine oxidoreductase, hao hydroxylamine oxidoreductase.

