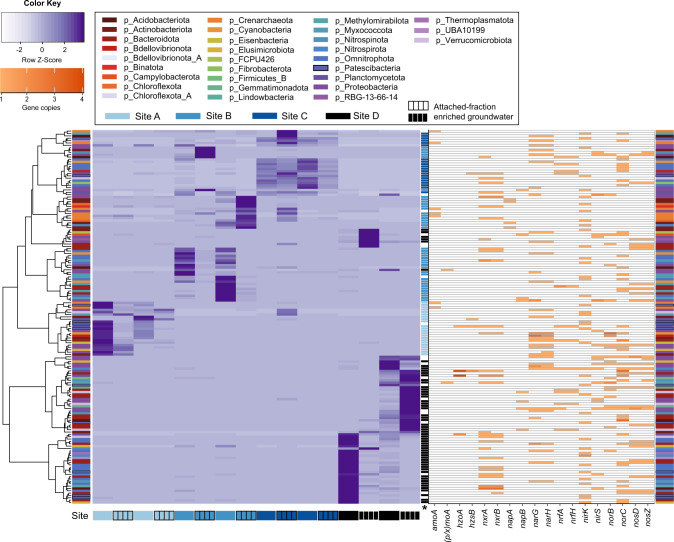
Fig. 3. Heatmap showing 159 MAGs, coloured according to phylum, that contain nitrogen-cycling genes involved in non-assimilatory reduction and oxidation of N species in groundwater.
Purple gradient (right) represents genome coverage scaled by row (Z-Score) across sites A–D (ordered gwj01-16). Rows = MAGs; columns = samples per site (groundwater and attached-fraction enriched groundwater). Orange gradient (right) represents number of nitrogen-cycling gene copies per genome. Microorganisms are ordered based on hierarchical clustering of abundance based Bray-Curtis dissimilarity matrix with ward.D2 clustering method. Final column (labelled with asterisk) indicates genomes that were significantly more abundant at a particular site (coloured rectangle) based on LEfSe analysis.

