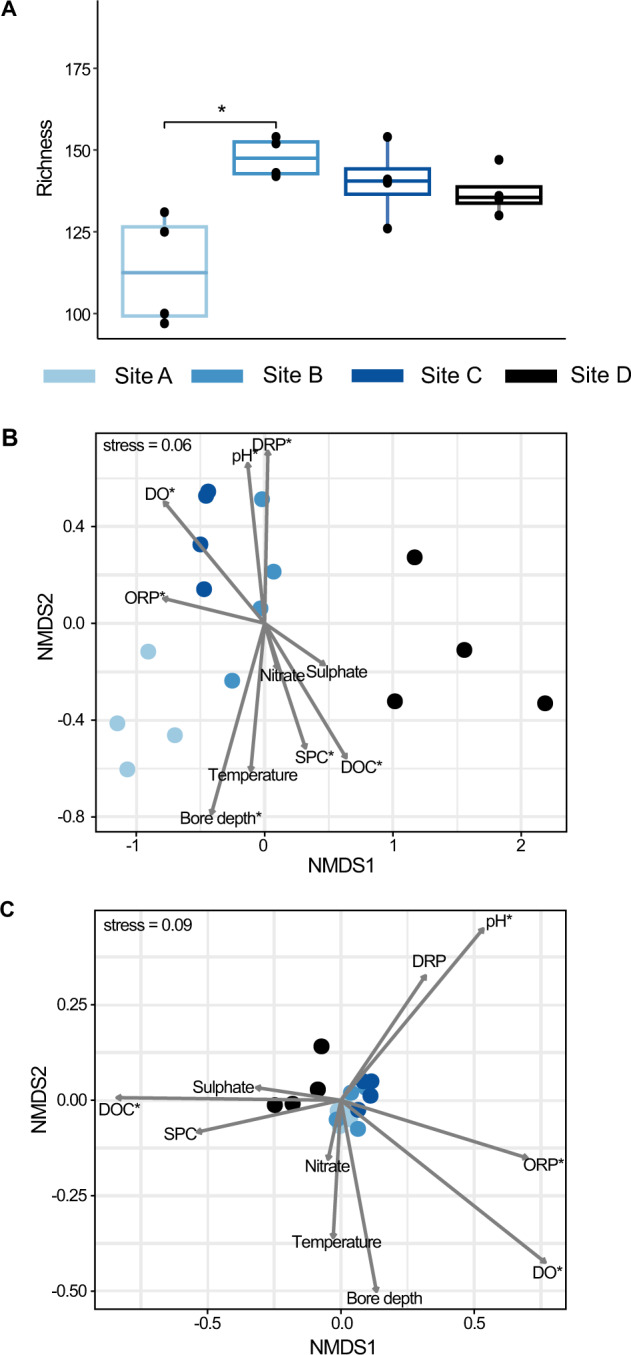
Fig. 5. Diversity of community fractions with N cycling capacity.

A Boxplots showing the median and interquartile range of richness of MAGs capable of nitrogen-cycling. Black solid circles show actual sample richness. Sites with significantly different richness are indicated by an overlying line and asterisk (Wilcoxon test, p < 0.05). B Non-metric Multi-dimensional Scaling plot showing groundwater community relatedness based on a Bray–Curtis dissimilarity matrix constructed using the relative abundance of MAGs with nitrogen-cycling genes. C Non-metric Multi-dimensional Scaling plot based on a Bray–Curtis dissimilarity matrix constructed using the relative abundance of protein-coding sequences in metagenomic reads. For ordinations environmental variables (Table S1) were fitted using envfit, and significant variables are indicated with an asterisk = p < 0.05. Ammoniacal-N and nitrite are not shown as >50% of values were below the detection limit and >50% of TKN values are missing.
