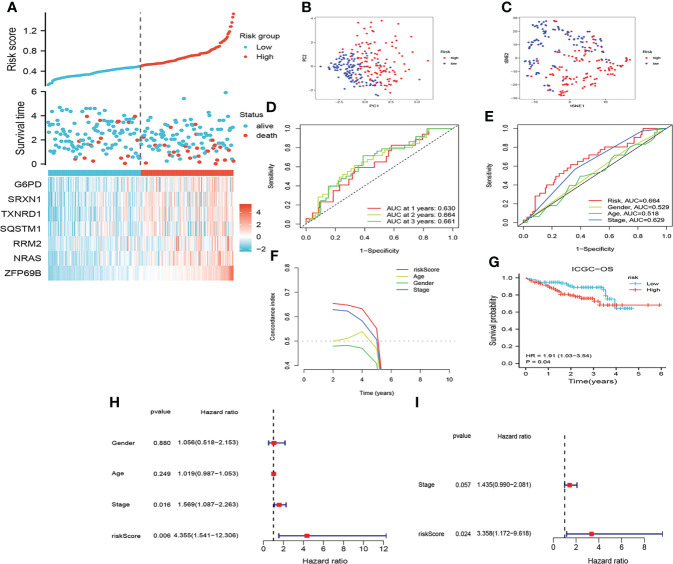
Figure 4.
Assessment of the prognostic signature (CRFs) in ICGC. (A) Survival status distribution. (B) PCA plot. (C) t-NSE plot. (D) timeROC curve of the risk score.(E) ROC curve of the age, gender, stage, and risk scores. (F) C-index curve of the age, gender, stage, and risk scores. (G) KM curves of OS. (H) Univariate Cox regression analysis of the age, gender, stage, and risk score in ICGC. (I) Multivariate Cox regression analysis of the stage and risk scores in ICGC.

