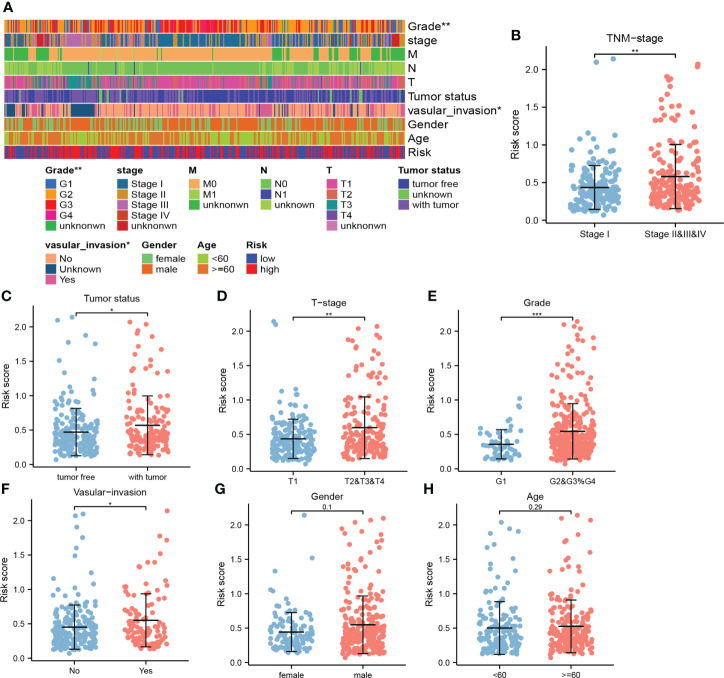
Figure 5.
The correlation between the risk score and clinical indicators. (A) The correlation heat map. (B) Comparison of risk scores in stage I and stage II, III, and IV. (C) Comparison of risk scores in tumor- free and tumor status. (D) Comparison of risk scores in T1 and T2, 3, and 4. (E) Comparison of risk scores in G1 and G2, G3, and G4. (F) Comparison of risk scores in the presence and absence of vascular invasion. (G) Comparison of risk scores in men and women. (H) Comparison of risk scores at ages ≥60 vs ≤60 years old. (*, **, and *** represent p < 0.05, p < 0.01, and p < 0.001, respectively).

