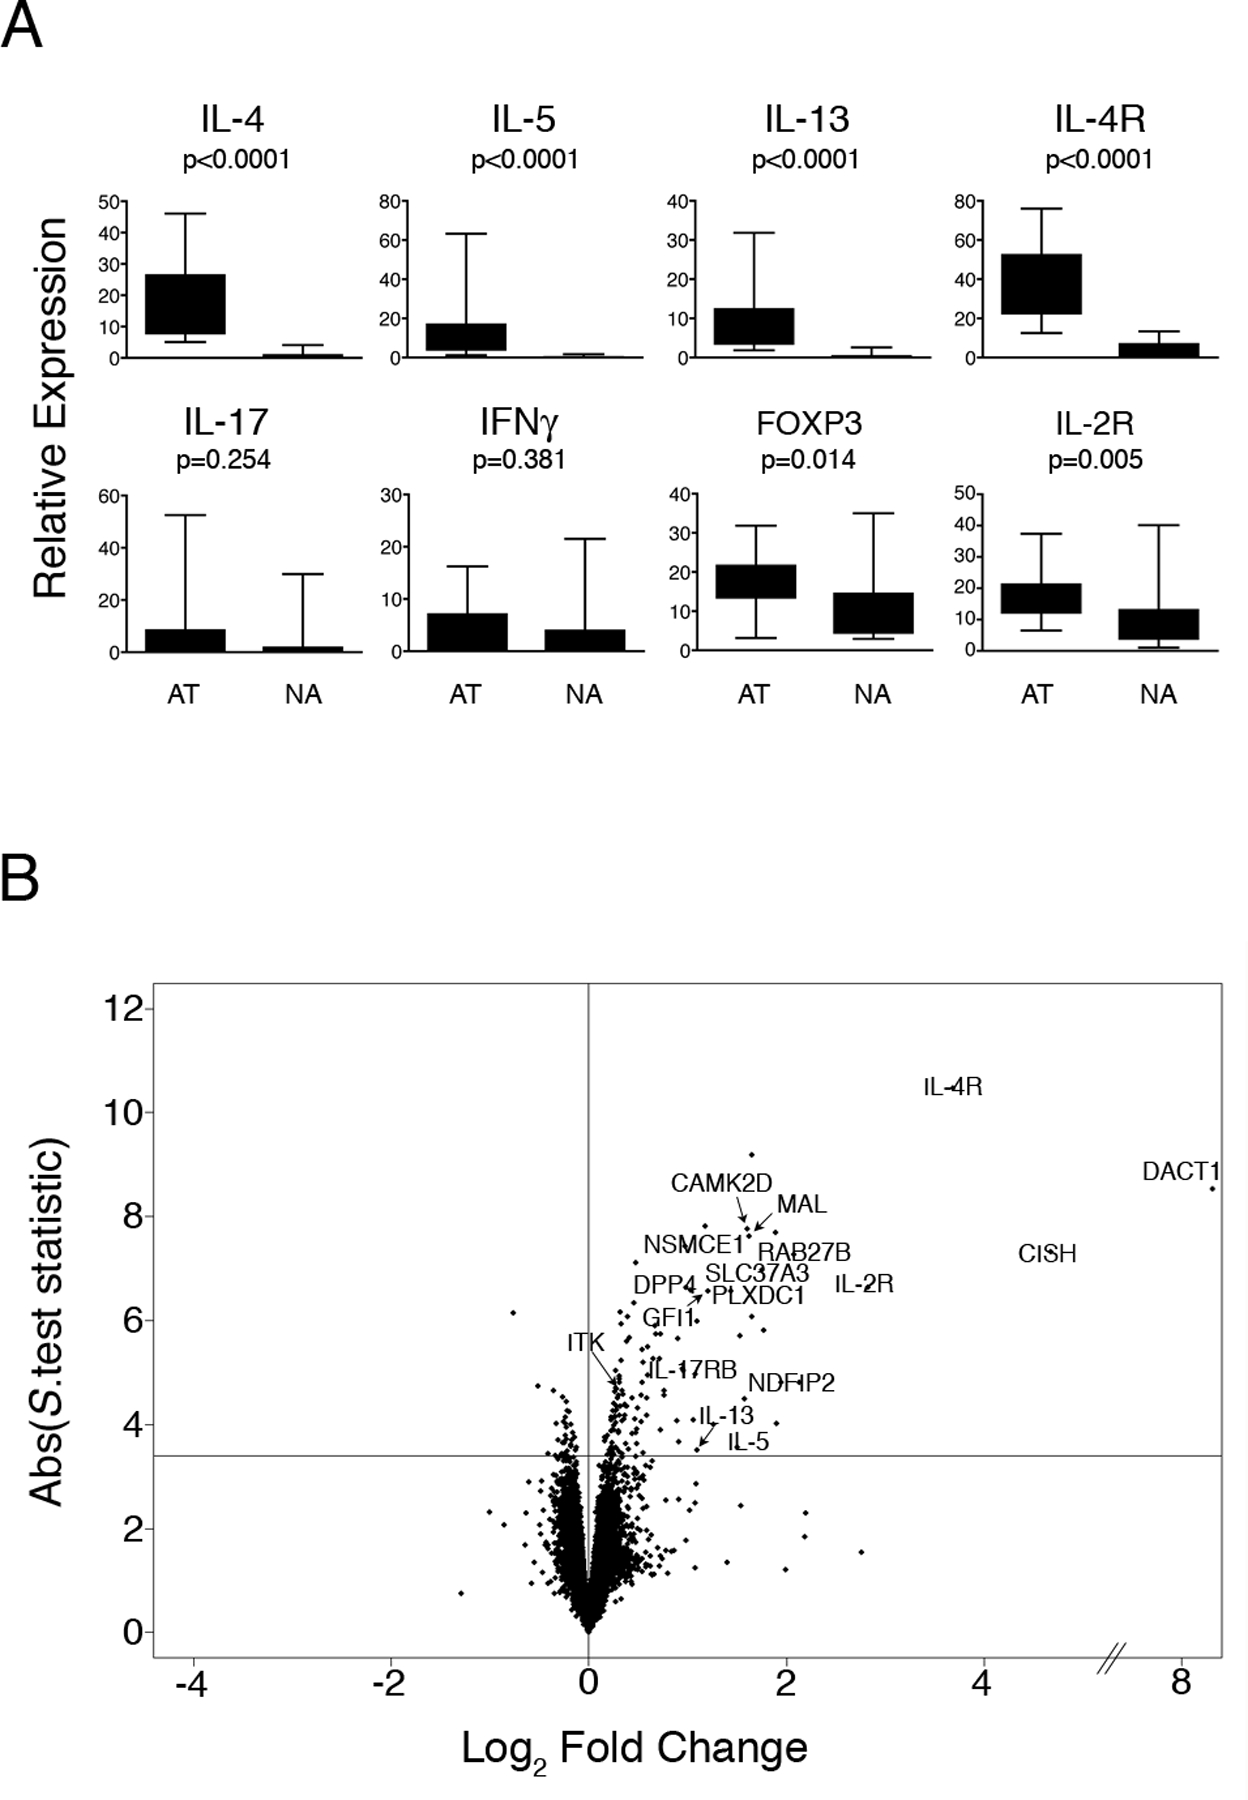
Figure 1: CD4+ Th-cell response patterns to allergens in atopic and nonatopic subjects.

PBMC from HDM-sensitized atopics (n=15) and nonatopic controls (n=15) were cultured in the presence or absence of HDM for 24 h. At the termination of the cultures, CD4+ Th-cells were isolated and gene expression was profiled by qRT-PCR and microarray analysis.
(A) qRT-PCR analysis of selected Th-lineage signature genes demonstrates the Th2-skewed response phenotype of the atopic subjects. Data are expressed as gene expression level above baseline relative to the stably expressed gene EEF1A1 (68). Abbreviations: AT, atopic, NA, nonatopic. Statistical analysis by Mann-Whitney U.test.
(B): Microarray analysis of differential gene expression in atopic and nonatopic responses. Background corrected gene expression levels (level in HDM-stimulated cells relative to baseline control (HDM/ctr)) were compared in atopic and nonatopic responses employing the S.test (20). The data are summarized as a Volcano plot (21); which displays microarray data along axes of statistical significance (absolute S.test statistic) and differential expression magnitude (atopic HDM/ctr : nonatopic HDM/ctr on the log2 scale (Log2 Fold Change)). Genes above the horizontal line are significantly differentially expressed (FDR adjusted p-value < 0.01); positive and negative values on the horizontal axis indicate elevated expression in atopic and nonatopic responses respectively. Abbreviations: ABS, absolute.
