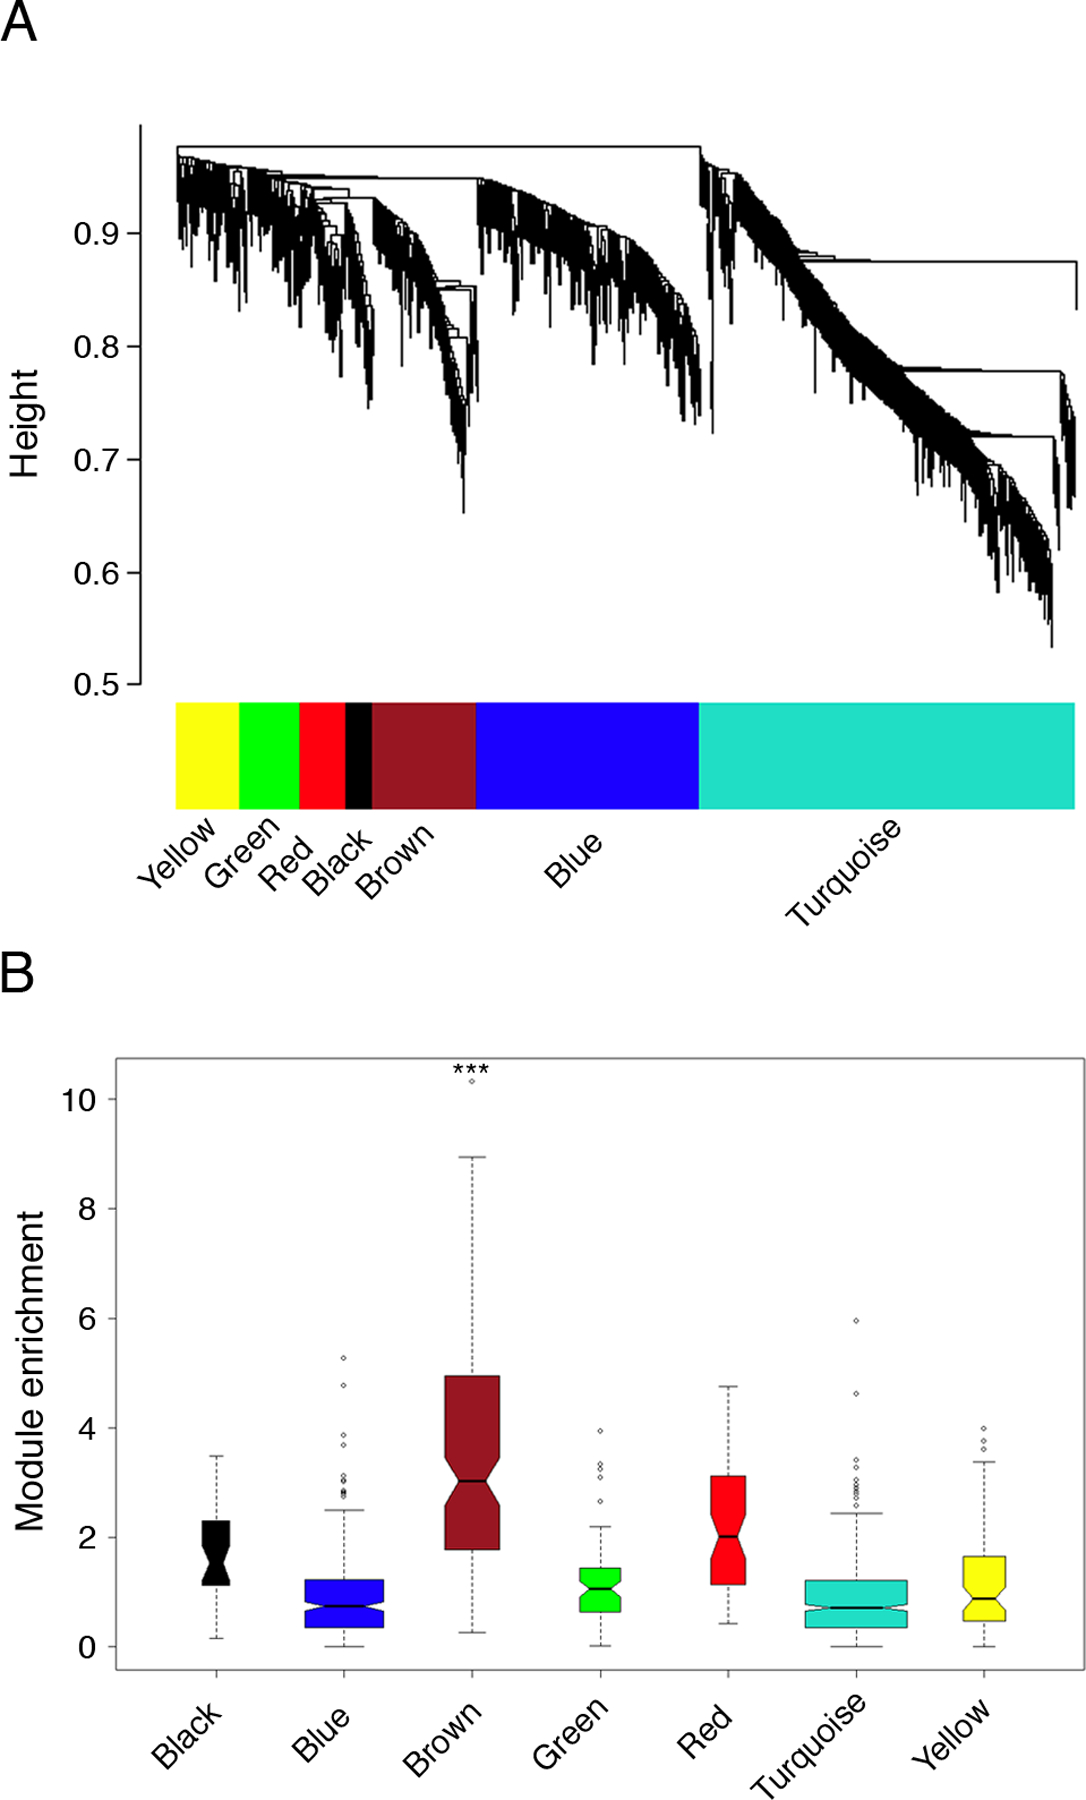
Figure 2: Modular architecture of the gene coexpression network in atopic CD4+ Th-cell responses to allergens; variations associated with allergic sensitization.

(A) Network analysis was performed on the atopic CD4+ Th-cell response microarray data set from Fig. 1B, and hierarchical clustering was employed to resolve the network into subnets (modules) of highly interconnected genes (10). The modules were defined by an automated algorithm (23), and can be visualized as the internal branch-like structures of the dendrogram output from the cluster analysis.
(B) The brown module is uniquely associated with atopic status. Background corrected gene expression levels (HDM/ctr) were compared in atopic and nonatopic responses employing the S.test (20), and the absolute value of the S.test statistics were graphed as box-and-whisker plots on a module-by module basis to visualize module enrichment. Statistical analyses were performed to compare the overall expression of each module in atopic and nonatopic responses employing Gene Set Analysis (*** FDR-adjusted p-value < 0.001) (24).
