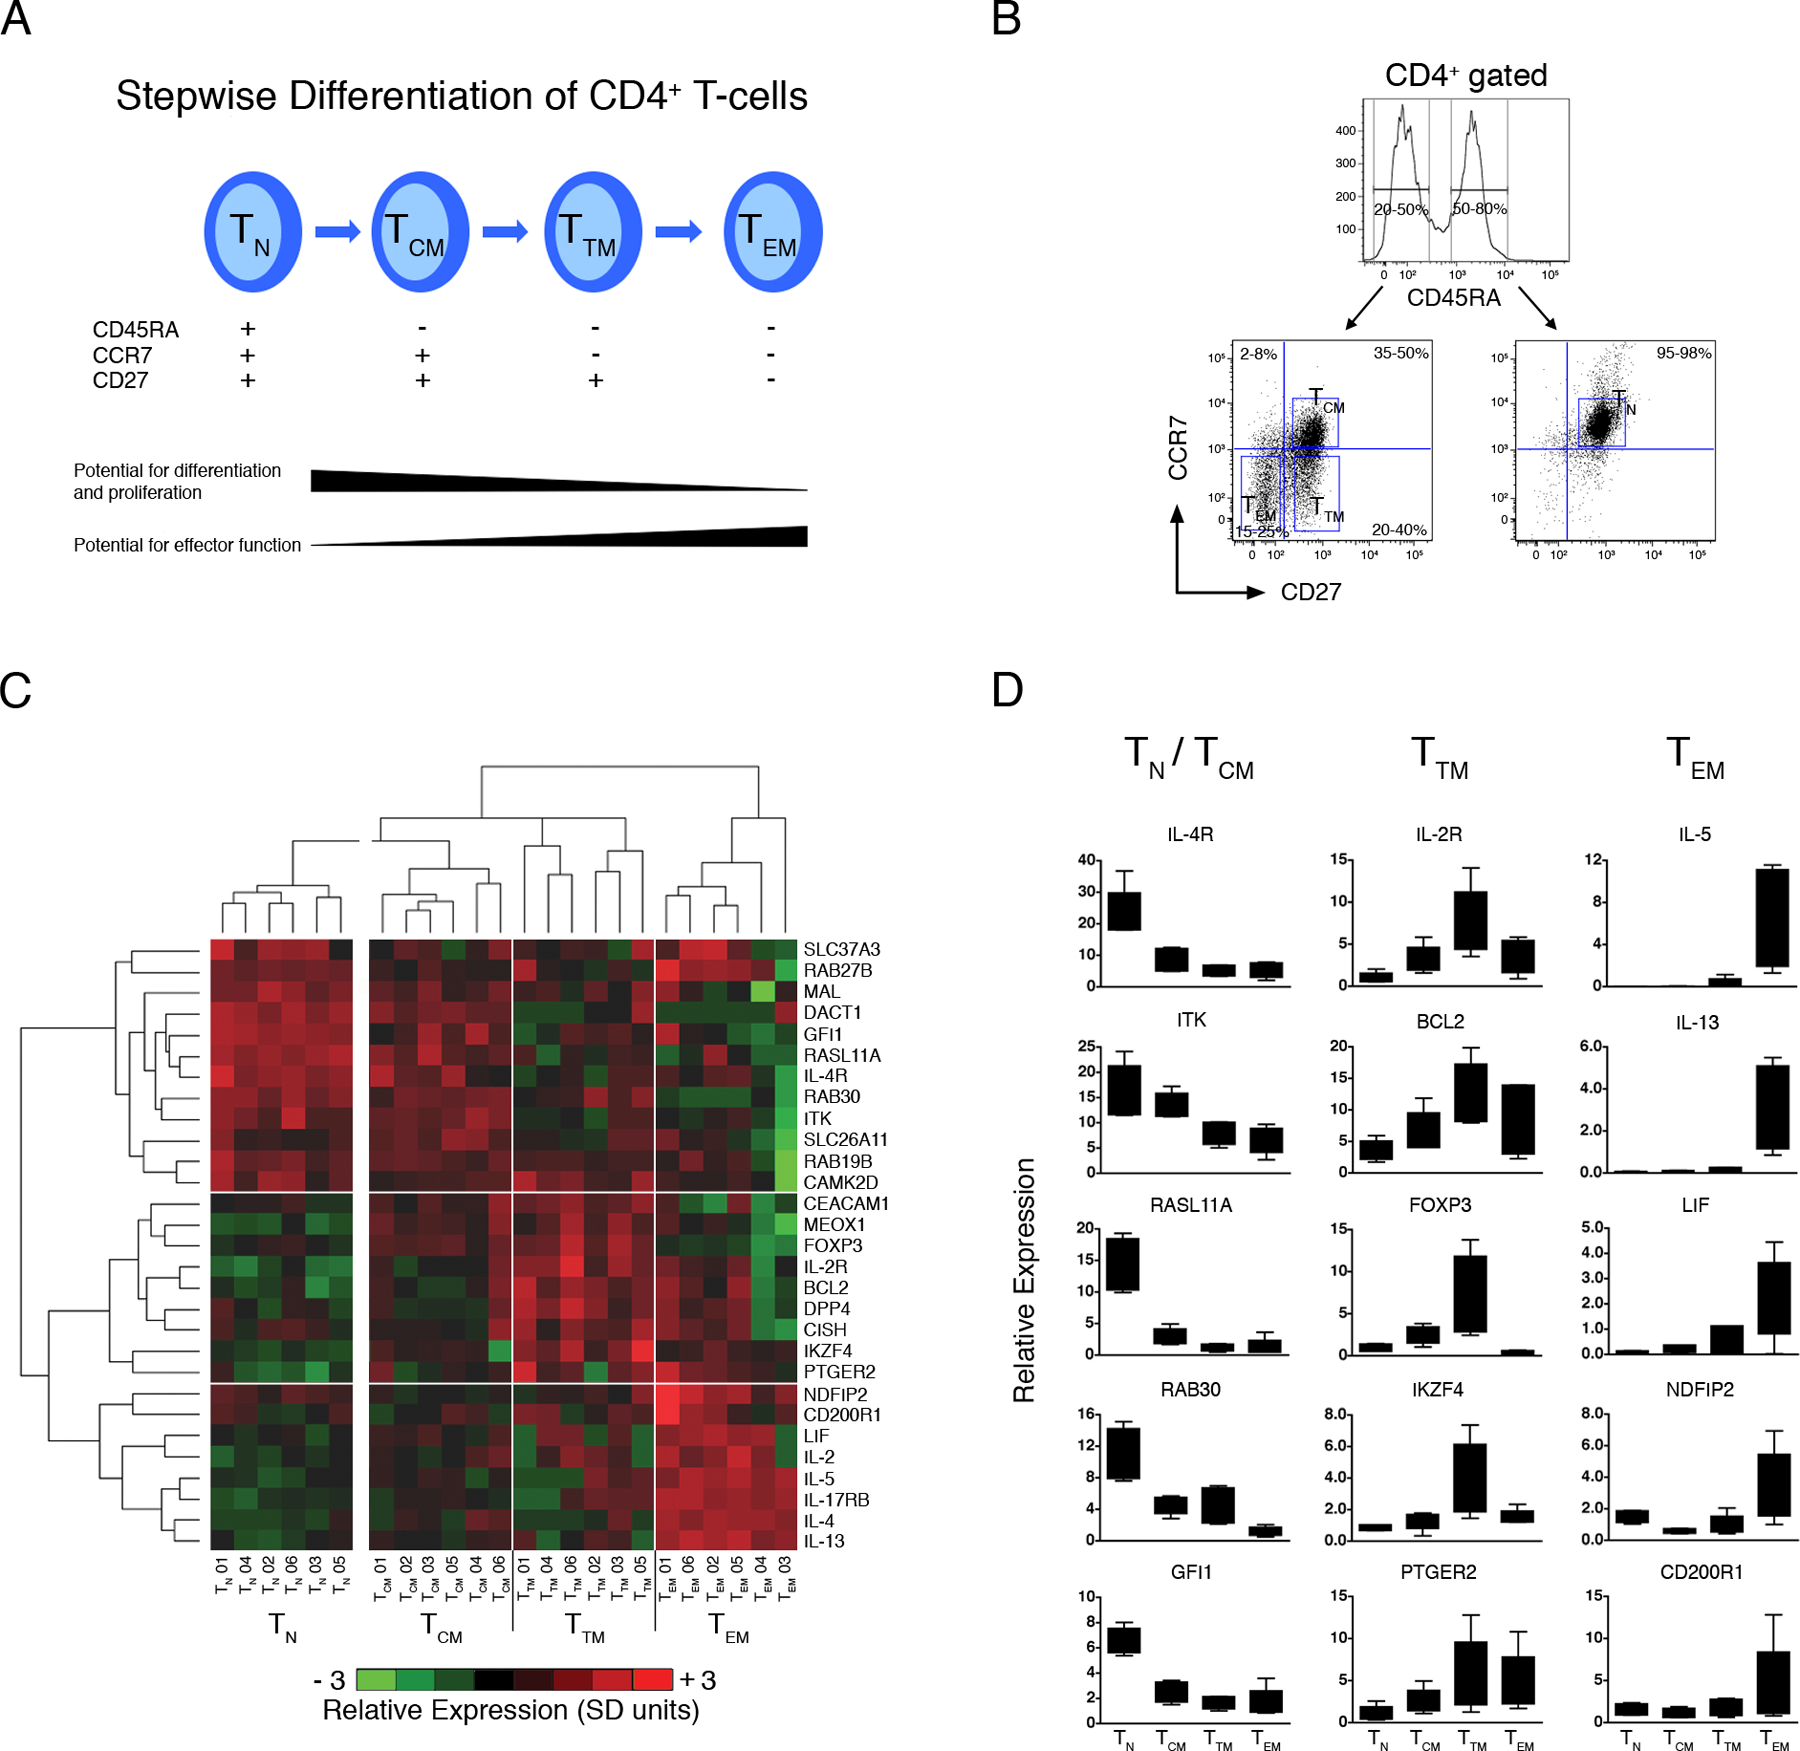
Figure 5: Expression of the atopy-associated module varies across naive and memory CD4+ Th-cell subsets.

(A) Stepwise model of CD4+ Th-cell memory differentiation (38).
(B) Multiparametric cell sorting strategy employed to isolate CD4+ Th-cell subsets.
(C) PBMC from HDM-sensitized atopics (n=6) were stimulated with HDM for 20 h. At the termination of the cultures, multiparametric cell sorting was employed to isolate naive (TN), central memory (TCM), transitory memory (TTM) and effector memory (TEM) subpopulations. Expression of a subset of genes from the atopy-associated module was profiled by qRT-PCR. The qRT-PCR data was normalized to the stably expressed gene EEF1A1 (68), log2 transformed, mean centered (26), and scaled for unit variance (26). Mean centering and unit variance was performed separately for the naive and memory compartments to emphasize variations across the latter compartment. Hierarchical clustering (10) was employed to identify clusters of coexpressed genes, and clusters of samples with similar expression profiles. Four major sample clusters and three major gene clusters were identified, as shown by the respective vertical and horizontal white lines. Detailed statistical analyses were performed and are presented online in Table S5. Abbreviations; SD, standard deviations.
(D) Box-and-whisker plots of the qRT-PCR data (centering, scaling, and log transformation was not performed) for selected genes from (C). See Table S6 for complete data set.
