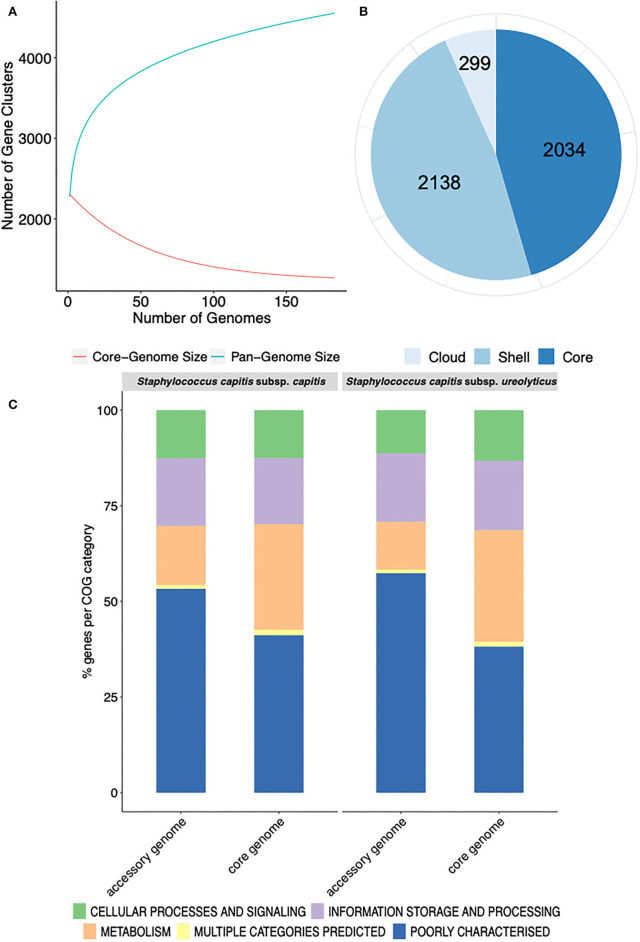
Figure 1.
Representation of the pan-genome and COG functional annotation of S. capitis genomes. (A) Pan-genome curve generated by plotting the total number of gene families in the pan (blue) and core (red) genome of S. capitis. The graph represents how the pan- and core-genomes vary as genomes are added in random order. As the number of genomes increased, the pan-genome increased. (B) Staphylococcus capitis pan-genome statistics. The size of the pan-genome, including core (shared by >95% of isolates), shell (found in 15–95% of isolates), and cloud (found in <15% of isolates) genes. (C) Functional annotation of the core and accessory genomes of S. capitis subsp. capitis and S. capitis subsp. ureolyticus. Percentages of the core and accessory genomes annotated according to COG functional categories.

