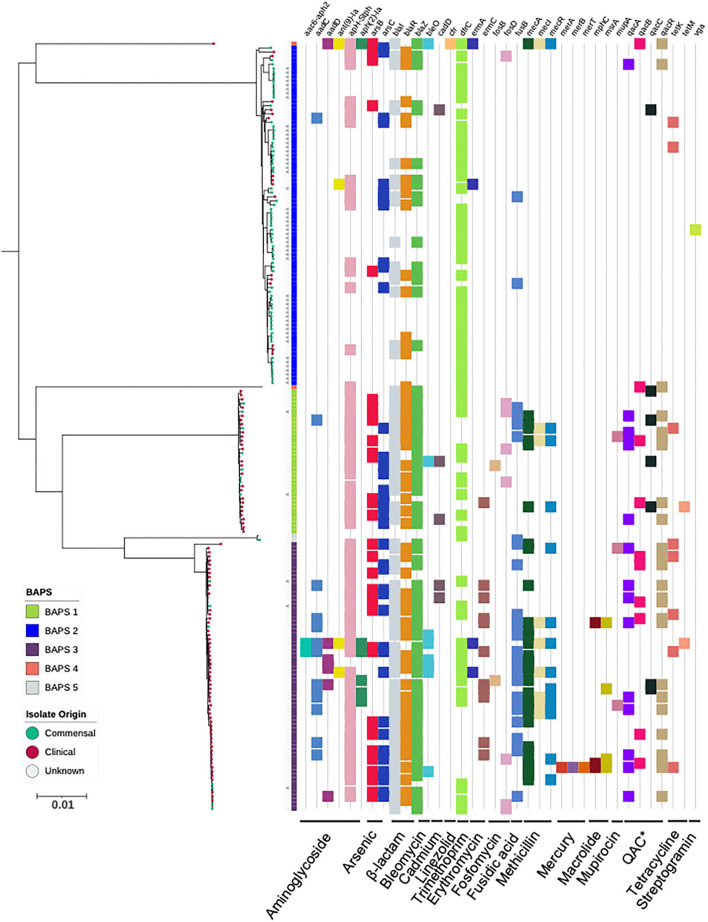
Figure 2.
Maximum-likelihood phylogeny based on core genome alignments of 186 S. capitis isolates, presenting the presence and absence of antimicrobial resistance genes. ML tree is midpoint rooted, and bootstrap support values were calculated from 1,000 replicates. The first color block represents rhierBAPS clustering, dots describe the setting where isolates were retrieved; green = commensal (including scalp samples from this study), red = clinical, and gray = unknown. Filled gray triangles describe scalp isolates from this study. The subspecies differentiation of S. capitis is presented as the subclades described as BAPS groups 1, 3, 4, and 5. The presence (colored blocks) and absence (white blocks) of antimicrobial resistance is denoted for each isolate (*Quaternary Ammonium Compounds). The scale bar represents the number of nucleotide substitutions per site. The figure was visualized using iTol v 4.2 (Letunic and Bork, 2016).

