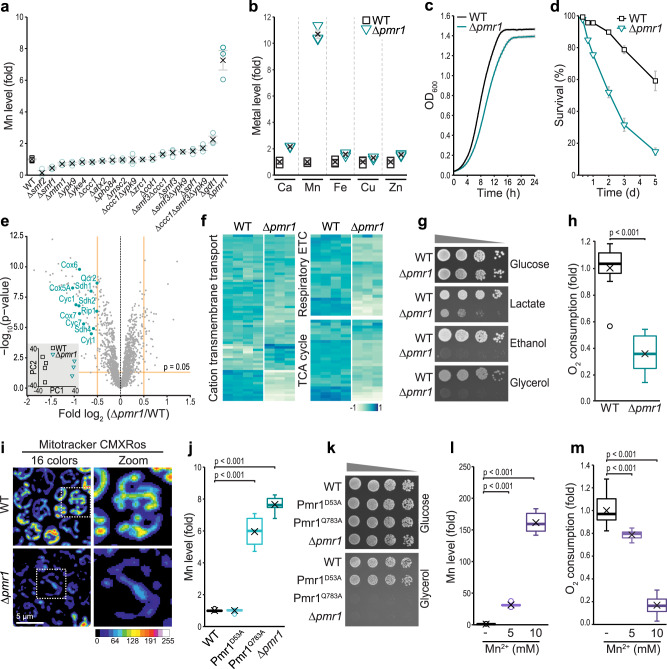
Fig. 1. Cellular Mn overload disrupts mitochondrial bioenergetics.
a, b Total cellular Mn (a) and metal (b) content of wild type (WT) cells and indicated mutants determined via Total reflection X-Ray Fluorescence (TXRF) spectrometry. Cells were collected after 24 h of growth on glucose. Means ± SEM; (a) n = 6 (WT) or 3 (mutants). (b) n = 3. c Growth kinetics of WT and ∆pmr1 cells grown as described (a, b). Means ± SEM, n = 8. d Survival determined by flow cytometric quantification of propidium iodide staining of WT and ∆pmr1 cells at indicated time points during aging. Means ± SEM, n = 8 (8 h and 120 h) or n = 12 (16, 24, 48, and 72 h). e, f Whole-cell proteomics of WT and ∆pmr1 cells grown as described in (a, b). n = 4 (WT) or 3 (∆pmr1). e Volcano plot displaying results of differential protein abundance analysis (DeqMS). Significantly less or more abundant proteins of GO term ‘Respiratory electron transport chain’ are labeled. Inset: Scatterplot of principal component analysis. f Heatmaps of identified proteins associated with indicated GO terms. g Spotting of WT and ∆pmr1 cells on glucose, lactate, ethanol, and glycerol. h Polarographic determination of oxygen consumption of intact WT and ∆pmr1 cells grown for 24 h on glucose, n = 11. i Confocal micrographs of cells described in (h) stained with Mitotracker CMXRos to visualize mitochondrial transmembrane potential. j Total cellular Mn content determined via TXRF of WT, Pmr1D53A, Pmr1Q783A, and ∆pmr1 cells after 24 h of growth on glucose media, n = 8. k Spotting of cells described in (j) on glucose and glycerol. l Total cellular Mn content determined via TXRF of WT cells grown on glucose and treated with indicated concentrations of MnCl2 for 24 h. n = 8. m Oxygen consumption of cells described in (l), n = 8. Box plots (h, j, l, m) show mean (x), median (line), first/third quartile (lower/upper bound), minimum/maximum within 1.5-fold IQR (lower/upper whisker), and outliers outside 1.5-fold IQR (circle/o). Details for statistical analysis (Supplementary Table 9) and source data are provided.

