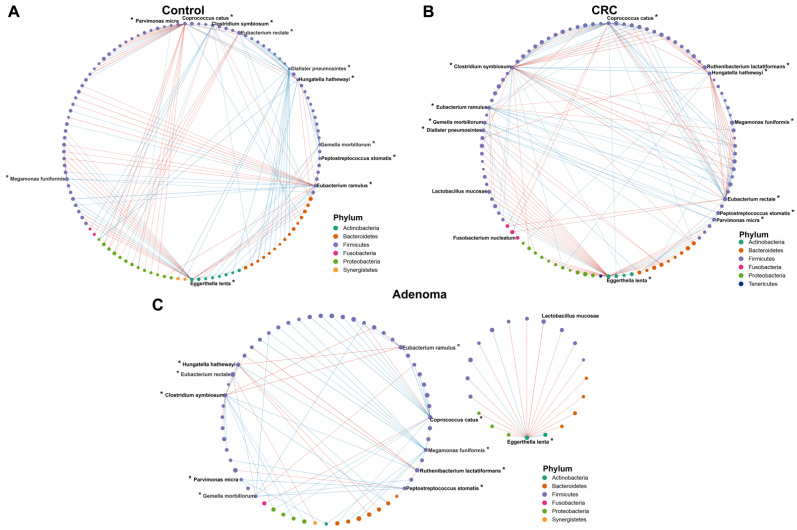
Figure 6.
The correlation networks across the bacteria in the control (A), CRC (B), and CRA (C) groups. Lines between dots indicate the significant correlation of species (p < 0.05). The blue line indicates a positive correlation, and the red line indicates the presence of a negative correlation. The size of the node is proportional to the relative abundance of species. The nodes are colored according to the phylum to which the species belongs. *, bacterial markers screened by the random forest model.

