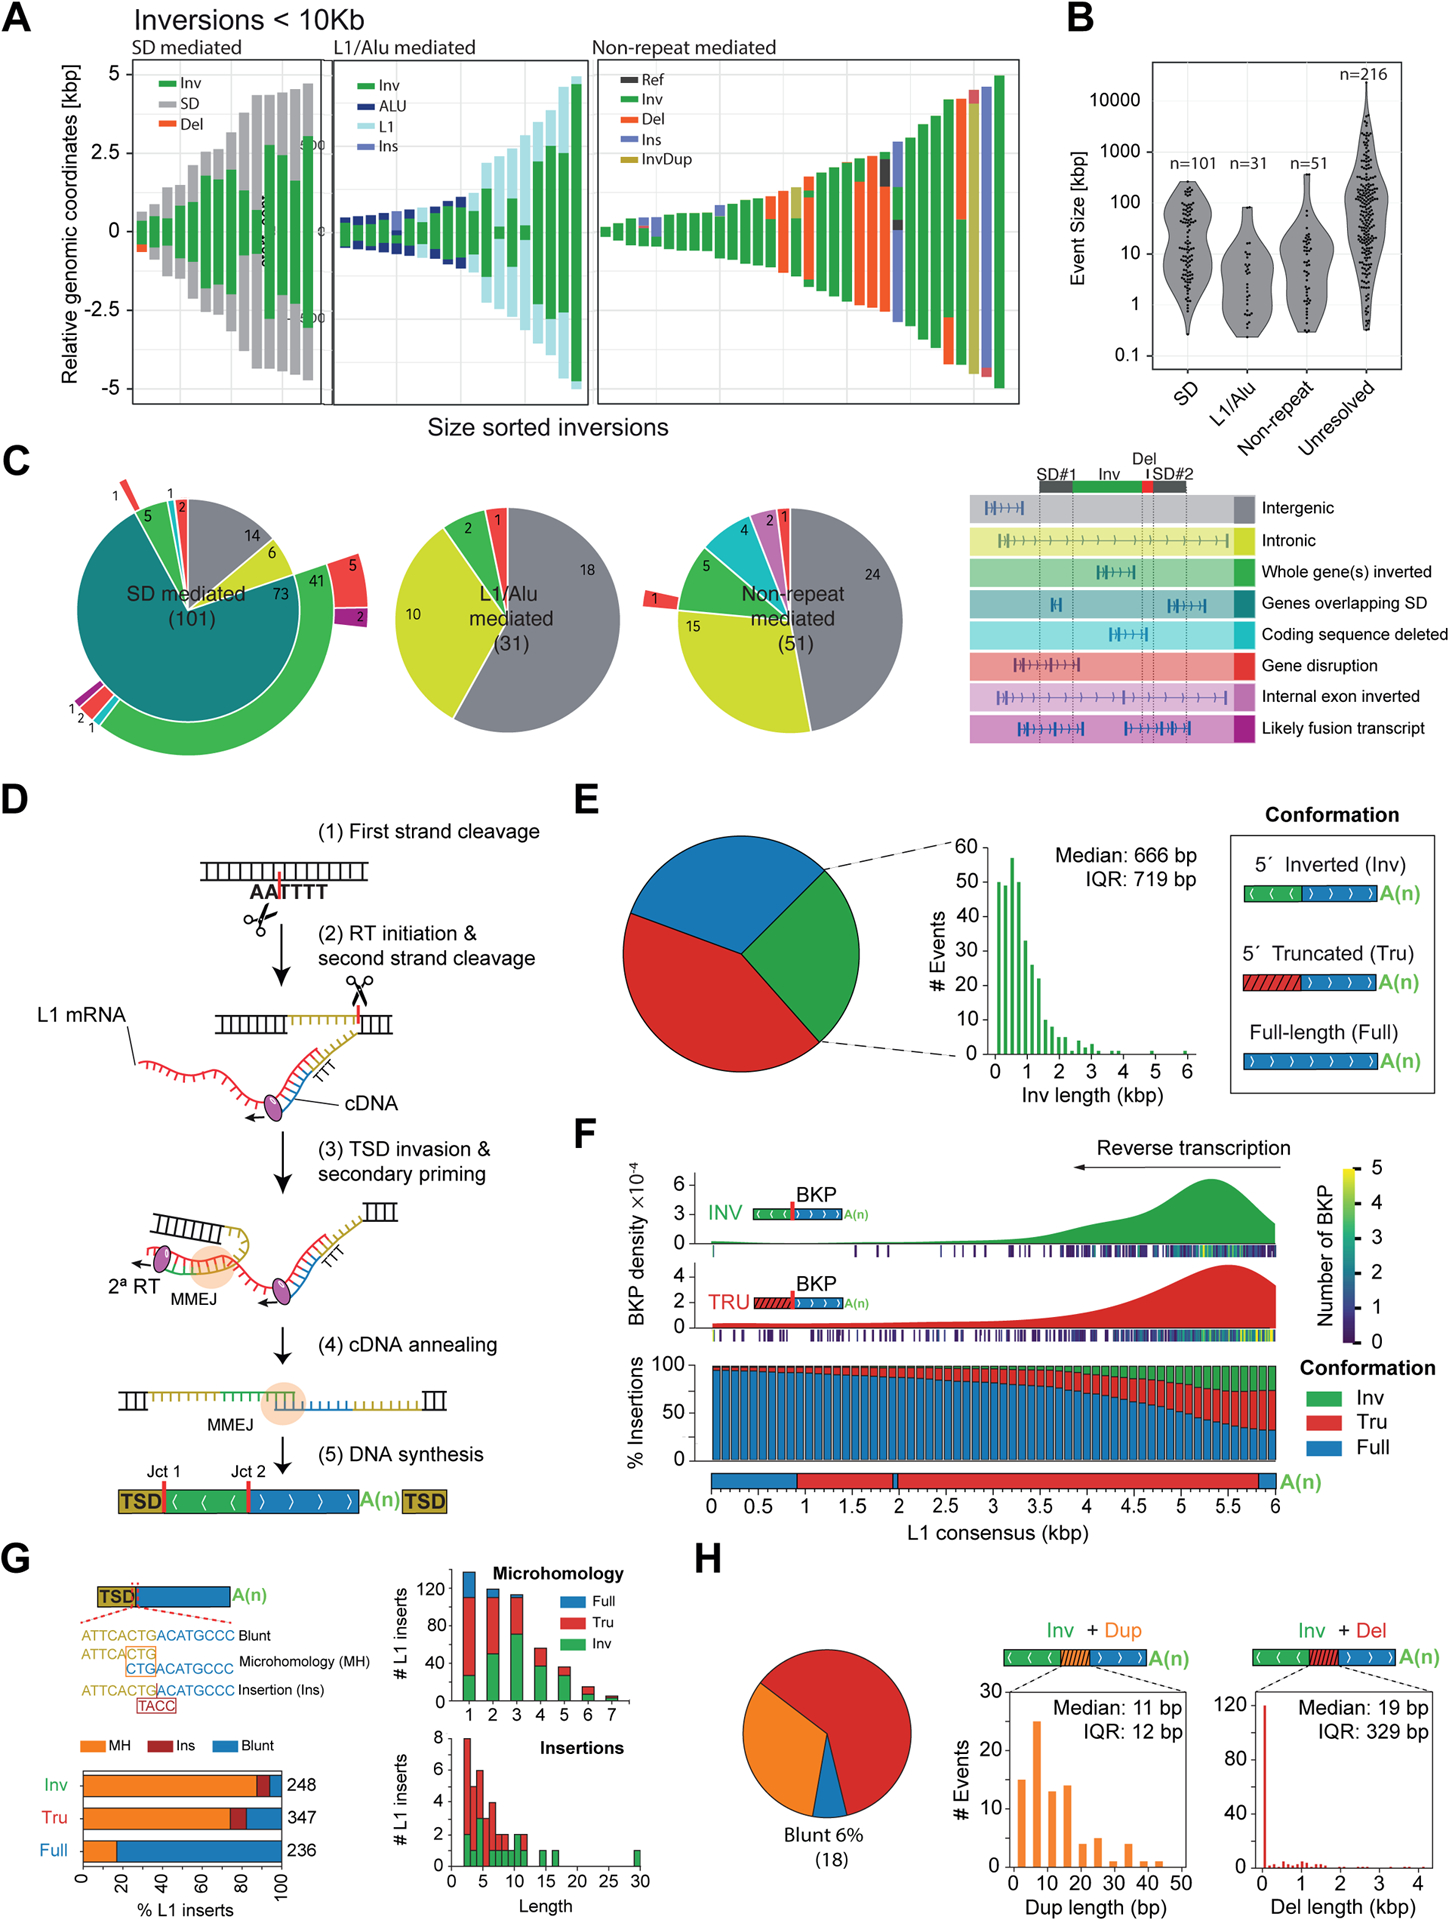
Figure 2. Inversion formation mechanisms.

A) Representation of inversions and their flanks for events <10 kbp (all sequence-resolved events are in Figure S1C). B) Size distribution for event types from (A). Unresolved: not assembled. C) Functional annotation of events. D) Depiction of twin-priming. (1) Cleavage of the first DNA strand by the L1-encoded endonuclease; (2) annealing of the L1 RNA poly(A) and initiation of reverse transcription (RT) at the free 3′OH; (3) after second strand cleavage, the derived single-stranded overhang at the 5′ TSD anneals internally to the L1 transcript, generating Junction 1 (Jct1); (4) the inverted and non-inverted cDNA products are annealed, generating Junction 2 (Jct2); both junctions are repaired by MMEJ; (5) retrotransposition finalizes with second strand synthesis and ligation. E) Size distribution for L1-associated events. IQR, interquartile range. F) Top, inversion and truncation breakpoint (BKP) density, using kernel density estimation (KDE). Bottom, likelihood of each L1 integration outcome while L1 RT progresses towards the 5′ end of L1 mRNA sequence. G) Left, fraction of full-length, 5′ deleted and inverted L1 inserts exhibiting microhomology, nucleotide insertions, and blunt joints between the 3′ end of the TSD and the 5′ end of the integrated L1. Right, size distribution (bp) for microhomologies and insertions. H) Inversion junction conformations with duplicated (Dup) and deleted (Del) pieces of L1 sequence and blunt joins.
