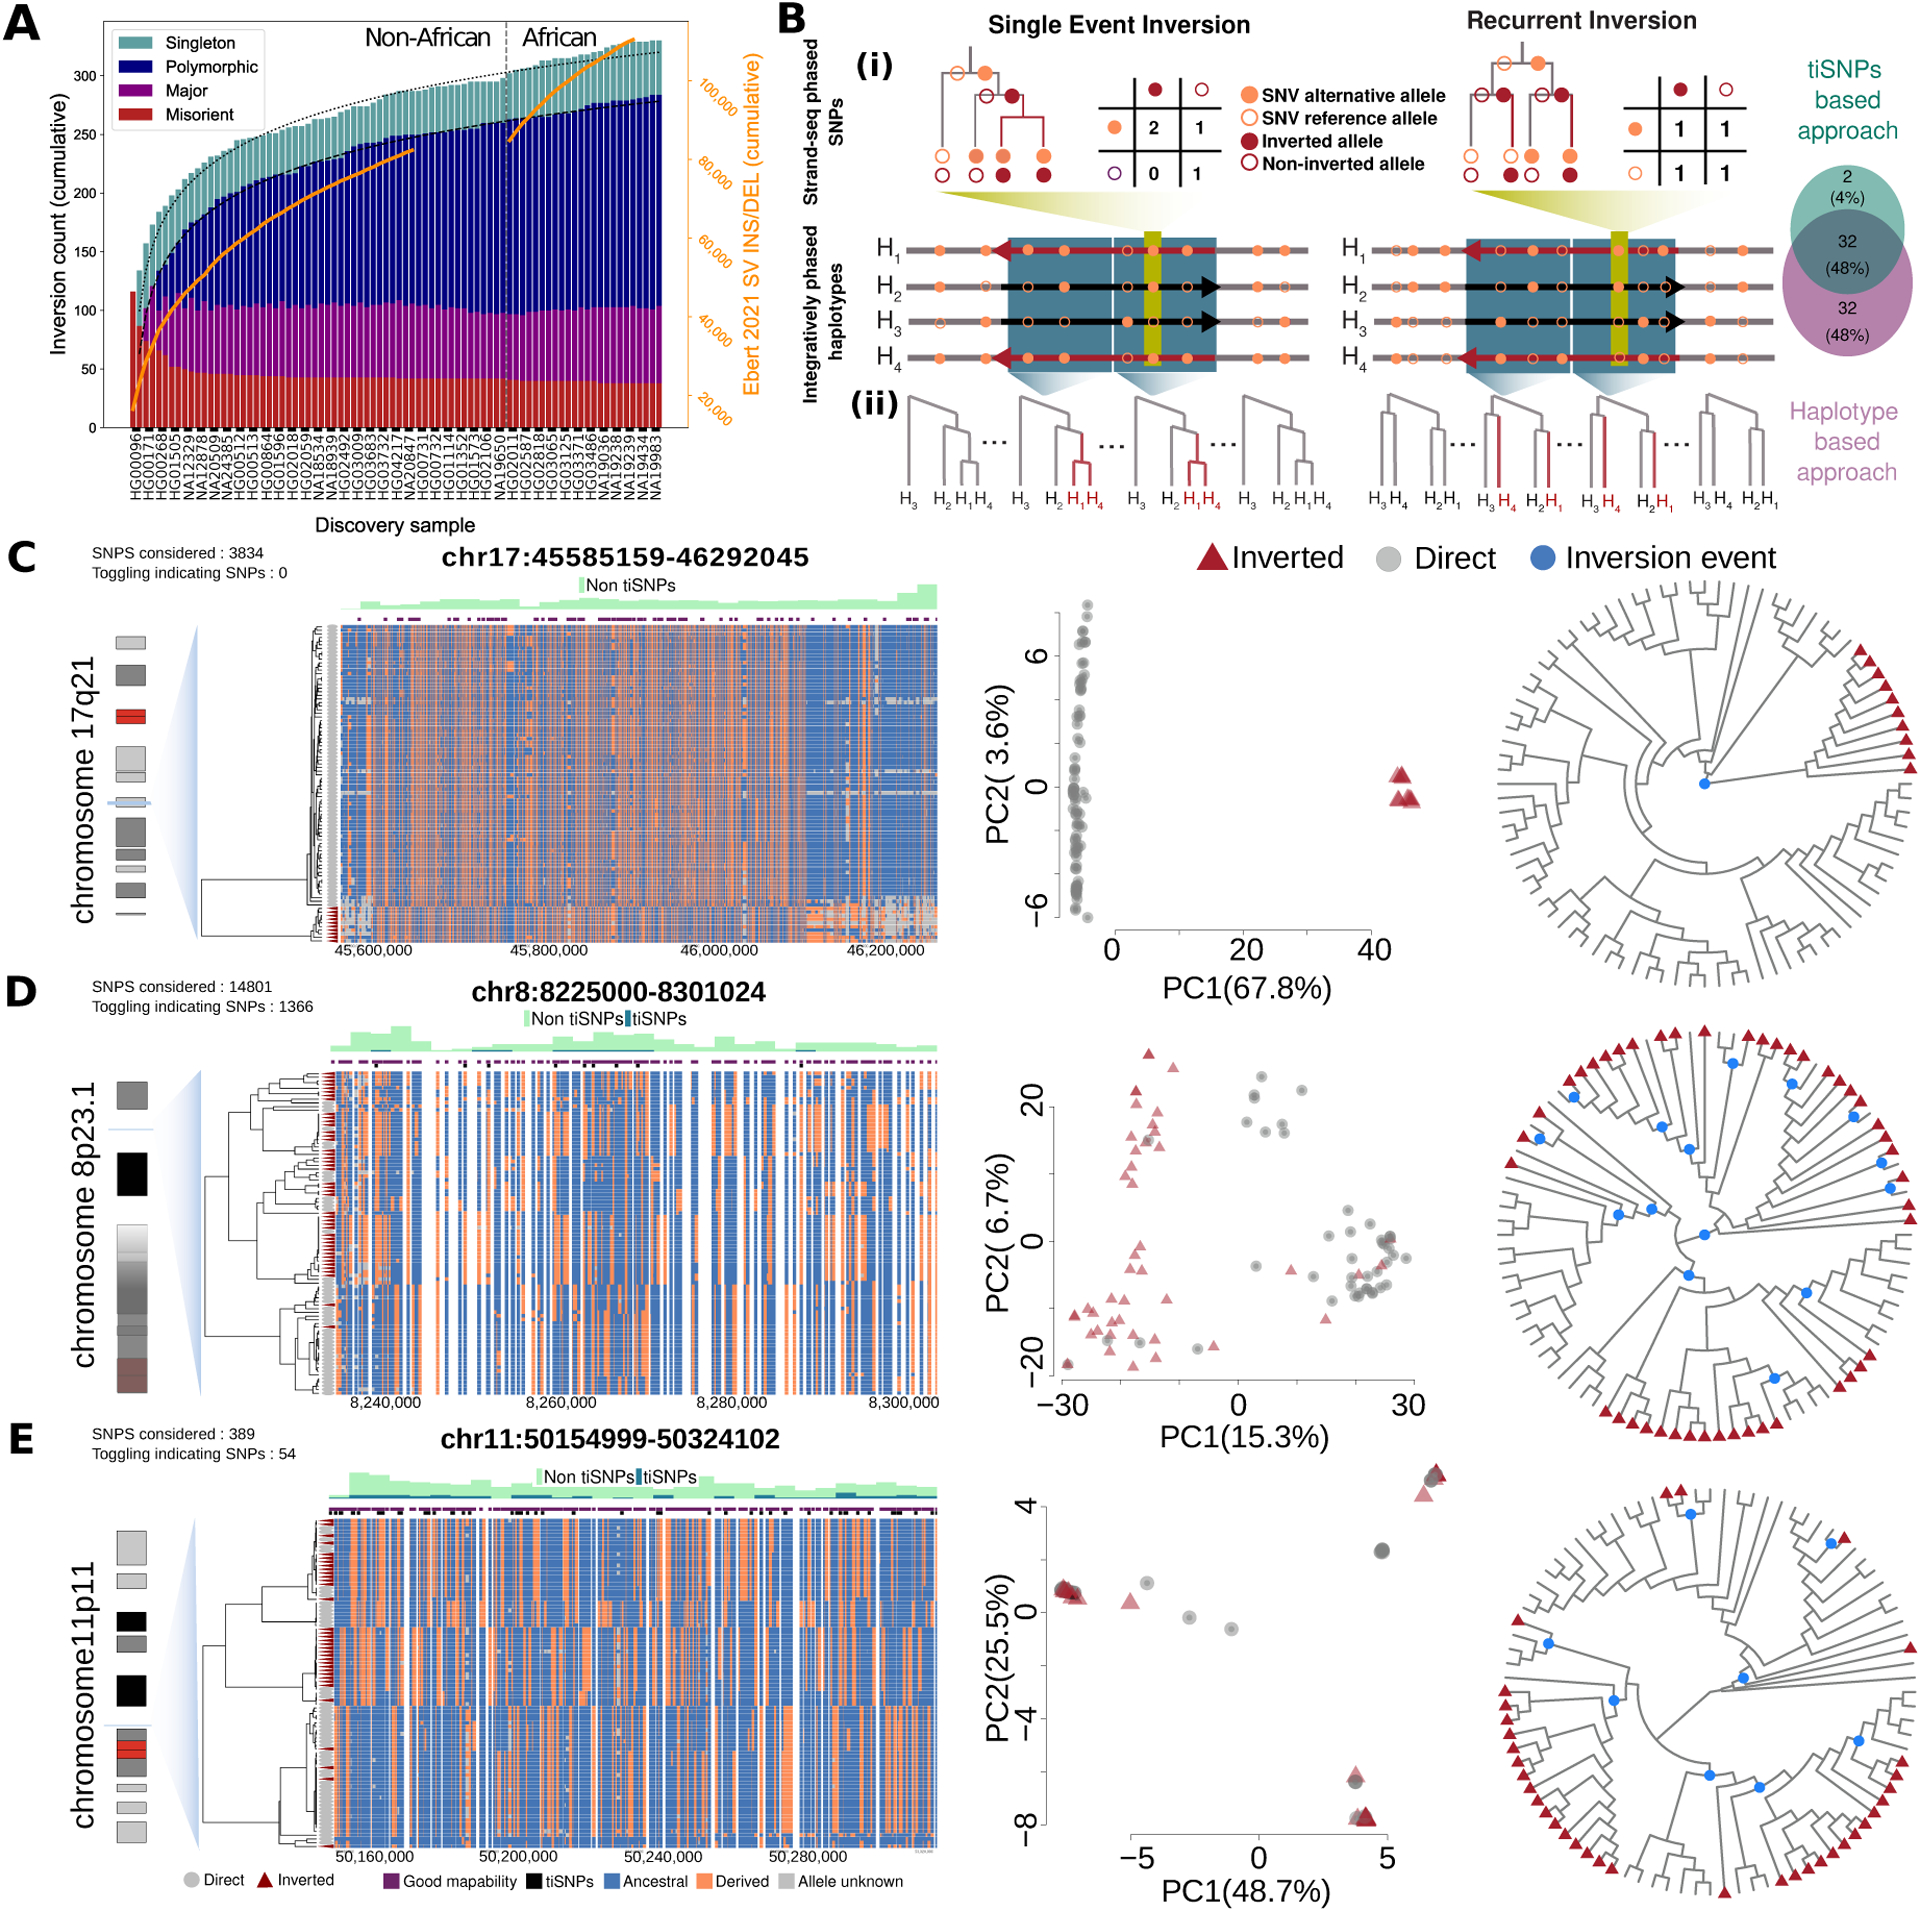
Figure 3. Recurrence of balanced inversions in the human genome.

A) Rate of balanced inversions discovered with each added genome differs from SV insertions and deletions (orange lines, right axis). Dotted lines fit logarithmic model growth. Singleton: 1 allele; polymorphic: AF < 50%; major: AF ≥ 50% (but less than 100%), putative misorient: AF = 100%. B) Inversion recurrence detection: (i) tiSNPs based, (ii) Haplotype based approach. Venn diagram depicts overlap by approach for 127 tested inversions. C–E) Evidence for single (C, 17q21) and recurrent (D, 8p23.1 [distal part chr8:8225000-8301024]; E, 11p11) loci. Left: dendrograms (centroid hierarchical clustering method) show relationships among inverted and direct-oriented haplotypes. Ancestral (blue) vs. derived (orange) SNPs, informative tiSNPs (black) and SNPs with ≥75% mappability (purple) are shown. Middle: haplotype-based principal component (PC) analysis. Right: inferred cladograms of the loci of interest. Blue dots, putative inversion events.
