

Abstract
Industrial chemical contamination within coastal regions of the Great Lakes can pose serious risks to wetland habitat and offshore fisheries, often resulting in fish consumption advisories that directly affect human and wildlife health. Mercury (Hg) is a contaminant of concern in many of these highly urbanized and industrialized coastal regions, one of which is the Saint Louis River estuary (SLRE), the second largest tributary to Lake Superior. The SLRE has legacy Hg contamination that drives high Hg concentrations within sediments, but it is unclear whether legacy-derived Hg actively cycles within the food web. To understand the relative contributions of legacy versus contemporary Hg sources in coastal zones, Hg, carbon, and nitrogen stable isotope ratios were measured in sediments and the food webs of SLRE and the Bad River, an estuarine reference site. Hg stable isotope values revealed that legacy contamination of Hg was widespread and heterogeneously distributed in sediments of SLRE, even in areas lacking industrial Hg sources. Similar isotope values were found in benthic invertebrates, riparian spiders, and prey fish from SLRE, confirming legacy Hg reaches the SLRE food web. Direct comparison of prey fish from SLRE and the Bad River confirmed that Hg isotope differences between the sites were not attributable to fractionation associated with rapid Hg bioaccumulation at estuarine mouths, but due to the presence of industrial Hg within SLRE. The Hg stable isotope values of game fish in both estuaries were dependent on fish migration and diet within the estuaries and extending into Lake Superior. These results indicate that Hg from legacy contamination is actively cycling within the SLRE food web and, through migration, this Hg also extends into Lake Superior via game fish. Understanding sources and the movement of Hg within the estuarine food web better informs restoration strategies for other impaired Great Lakes coastal zones.
1. Introduction
Coastal shoreline and embayment habitats within the Laurentian Great Lakes are closely tied to the overall health of the lakes and serve important ecological, economic, and cultural functions (Sierszen et al., 2012, Allan et al., 2013). Shoreline wetlands often span across the river-lake transition zones within tributary mouths and act as a sink for upstream loadings of nutrients and other contaminants (Larson et al., 2013) helping mitigate eutrophication in open waters (Robertson and Saad, 2011). As a result, these highly productive regions host substantial biodiversity and support the offshore food web by providing spawning zones and nursery habitats for migratory game fish, as well as an abundance of prey items (Trebitz and Hoffman, 2015). The commodities associated with shoreline habitats at estuarine zones were historically important to industrial and economic development within the Great Lakes in the late 1800s and early 1900s, often supporting active shipping ports and high levels of urbanization (Bellinger et al., 2016). Rapid industrialization within estuarine regions led to chemical contamination and degradation at numerous coastal shoreline and embayment habitats (U.S. EPA, 2020), warranting remedial and restoration actions to improve environmental conditions and mitigate the bioaccumulation of contaminants within Great Lakes food webs.
Mercury (Hg) is one of the most ubiquitous contaminants in aquatic sediments, specifically within the Great Lakes, and it readily bioaccumulates and biomagnifies through the food webs as the organic form, methylmercury (MeHg). Fish Hg tissue concentrations are notably high within some tributary mouths associated with past industrial activity, such as the Saint Louis River estuary (SLRE), resulting in widespread Hg impairments (Andersen et al., 2013, U.S. EPA 2020). However, it is difficult to link legacy contamination directly to fish Hg burdens due to the varied distribution and bioavailability of different Hg sources. Within urbanized systems, Hg can be linked to industrial releases, non-point urban source runoff, atmospheric deposition, and subsequent downgradient transport in watersheds (Janssen et al., 2019. Hg can also be linked to direct atmospheric precipitation, as seen in offshore compartments of the Great Lakes (Glass et al., 1986; Hall et al., 2005). Multiple Hg sources coupled to dynamic sediment movement, seiche driven flows, and variable water levels often make contaminant assessment within freshwater estuaries difficult. In addition, complex interactions surrounding the relative bioavailability of varying Hg sources for conversion to MeHg by natural microbial communities further complicate attempts to prescribe effective remediation. This is especially challenging at ecologically important wetland regions that generally exhibit substantial microbial activity and elevated MeHg production (Beck and Johnson, 2014), varying water levels (Eckley et al., 2017), and serve as important ecological zones for fish reproduction and foraging (Hoffman et al., 2010).
The measurement of naturally occurring stable isotope ratios of Hg in the environment can serve as powerful tools to identify Hg processes and sources (Blum et al., 2014; Tsui et al., 2020a). Mercury has seven naturally occurring stable isotopes that can each undergo distinct fractionation patterns from chemical, physical, or biological reactions resulting in mass dependent fractionation (MDF; represented as δ202Hg) and mass independent fractionations (MIF) resulting in odd-MIF (represented as Δ199Hg and Δ201Hg) or even-MIF (represented as Δ200Hg and Δ204Hg). Numerous kinetic and equilibrium processes can induce MDF (Blum et al., 2014, Tsui et al., 2020a) and δ202Hg has been extensively used to define Hg sources in the environment due to different fractionation patterns imprinted by industrial or atmospheric processes. δ202Hg values of industrial-use Hg tend to be very narrow in isotope distribution (δ202Hgave = −0.50 ± 0.27, Δ199Hgave = 0.00 ± 0.06, 1 standard deviation [SD], sediments from metal refining and elemental catalyst usage) (Eckley et al., 2020) and thus are commonly distinct from Hg sources that are derived from terrestrial runoff absent of industrial-use Hg (δ202Hgave = −1.31 ± 0.66, Δ199Hgave = −0.21 ± 0.18, 1SD, non-point source affected soils) (Blum et al., 2014). Odd-MIF commonly results from photochemical transformations of Hg (i.e. magentic isotope effect; Bergquist and Blum, 2007; Zheng and Hintelmann, 2010) and Δ199Hg values are useful for tracking the extent of Hg photochemical demthylation or reduction. When Hg delivered from certain sources is shielded from photochemical reactions, the Δ199Hg values are preserved and can serve as a source indicator for terrestrial Hg, resembling gaseous elemental Hg, which often is chracterized by negative Δ199Hg not commonly observed elsewhere (Eckley et al., 2020). Even-MIF occurs in the upper atmosphere; Δ200Hg values are conserved in near-surface processes, meaning Δ200Hg values can provide an estimation of the relative importance of atmospherically delivered Hg. Precipitation is often characterized by positive Δ200Hg values (e.g. Chen et al., 2012) and gaseous elemental Hg is often characterized by negative Δ200Hg values (e.g. Fu et al., 2016). In the Great Lakes region of the United States (U.S.), Hg isotope measurements have helped infer Hg sources in precipitation and gaseous elemental Hg (Gratz et al., 2010; Sherman et al., 2015) and sediments (Lepak et al., 2015a; Yin et al., 2016b). Likewise, similar results from Great Lakes fisheries have elucidated the controls on photochemical processing of Hg across the lakes (Lepak et al., 2018) and long-term shifts in Hg sources as a function of declines in air emissions and dietary shifts (Lepak et al., 2019). The ability to track Hg sources using isotopes has become an important tool for Great Lakes monitoring and can be expanded to the coastal regions to better assess the contributions of different Hg sources at locations of multiple-source convergence, such as freshwater estuaries.
In this study, Hg concentrations, Hg isotope ratios, and light isotope ratios of carbon and nitrogen (δ13C and δ15N) were combined to ascertain the influence of industrial Hg on the food web of SLRE. It was hypothesized that Hg from legacy sediment contamination via heavy industry practices and sewage effluent in SLRE (i.e., 1880s to 1970s) is still actively cycling and causing an isotopic enrichment and increased Hg concentration within aquatic and riparian biota, particularly in the industrially influenced bays within the lower estuary, near the river mouth. To test this hypothesis, Hg isotope values were measured in sediments to detect the presence and extent of industrial Hg sources within different regions of SLRE, encompassing industrially influenced bays near Lake Superior to an upper estuary region near Boy Scout Landing (30 km upstream from the river mouth) that was historically much less affected than the lower estuary. Second, to determine if prey and game fish were accumulating industrial sources, biological collections from SLRE were compared to analogous habitats in the Bad River, a tributary of Lake Superior absent of industrial contamination, presumably reflecting atmospheric Hg deposition to a watershed. Given the ecological complexities of SLRE, it was also predicted that game fish (Walleye, Northern Pike) and prey fish (shiners and Yellow Perch) would be exposed to different Hg sources (industrial, watershed runoff, or direct precipitation) based upon their habitat use and diet, determined by δ13C and δ15N. The application of multi-isotope approaches (Hg, C, N) to assess food web sources of Hg can be helpful in elucidating small-scale variation in Hg bioaccumulation within a coastal mosaic of nearshore, tributary, and wetland habitats characterized by varying anthropogenic influences.
2. Methods
2.1. Site Description
The Saint Louis River in Minnesota has been subjected to severe environmental degradation within the lower estuary reaches, leading to its listing as an Area of Concern within the Great Lakes (U.S. EPA, 2020). At the time of its listing, game fish targeted for human consumption from SLRE exceeded the Great Lakes Water Quality Agreement (1987) value for Hg of 500 ng g−1 (wet weight) and currently fish still exceed the U.S. Environmental Protection Agency (U.S. EPA) recommended MeHg fish consumption limit (300 ng g−1, wet weight) (U.S. EPA, 2020). Historical inputs of organic contaminants (polychlorinated biphenyls and dioxins) and heavy metals, now sequestered in river sediments, remain a concern due to their effect on critical habitats and potential transport into Lake Superior (Sorensen et al., 2004). The estuary is a drowned river mouth characterized by a shallow water habitat (generally < 2 m depth) that surrounds the main navigation channels (ca. 7 m depth) and is influenced by tributary discharge, seiche flows, and semi-diurnal tides (Trebitz, 2006). Lentic habitat extends from the river mouth 20 km upstream (inclusive of Superior Bay, St. Louis Bay, and Spirit Lake; Fig. 1) and industrial and residential development was historically concentrated along this part of the river. Urbanized shoreline and boat slips are found within the Saint Louis Bay and Superior Bay region, whereas higher wetland density is observed upstream in regions of Spirit Lake. To the east of Superior Bay is Allouez Bay (Fig. 1), a clay-influenced coastal wetland, formed behind a barrier beach with relatively little historical sediment contamination. Upstream from Spirit Lake (near Boy Scout Landing; Fig. 1), lotic habitat fringed by extensive wetlands extends another 10 km to the first dam on the Saint Louis River and development along this portion of the river is mostly low-density residential housing. Past sediment surveys of SLRE (DIVER, 2017) identified numerous distinct locations of elevated Hg indicating heterogenous distribution of the contamination within the river.
Fig. 1:
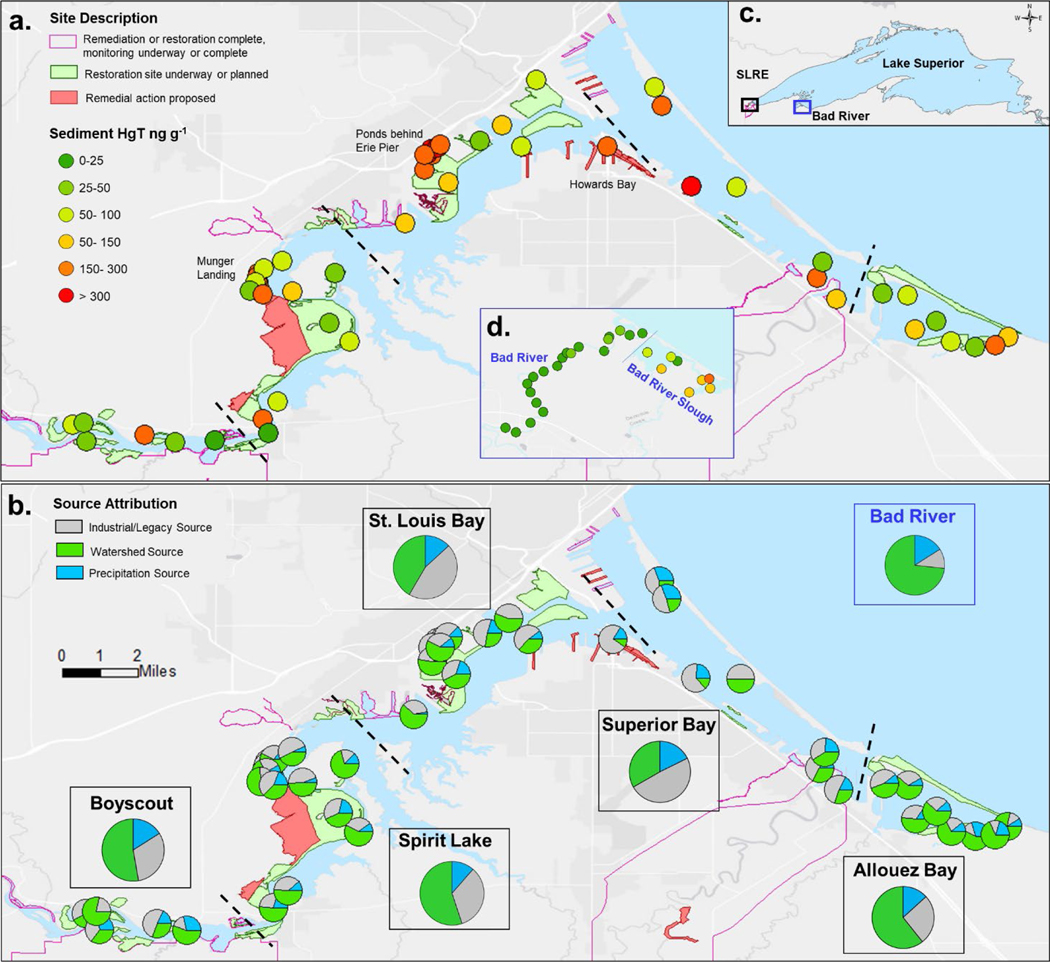
Distribution of surficial (0–4 cm) sediment (a) HgT concentrations in SLRE and (b) source contributions in SLRE determined by Hg isotopes. Inset (c) shows the location of SLRE and the Bad River reference site in Lake Superior and inset (d) shows sediment concentrations within the Bad River and Slough regions. Sampling regions are divided by dashed lines. Pie charts outlined in boxes in panel b represent the regional source profile in sediments. Sources were identified as industrial (defined by Hg within Howards Bay), watershed (as defined by the Bad River sites), and precipitation (defined from literature values -Sherman et al. 2015 and Gratz et al. 2010). Region-specific maps for SLRE concentrations and source attributions are found in Fig. S1, S4, and S5. Shape files for regions of remedial and restoration activity were provided by the Minnesota Pollution Control Agency. The base map image is the intellectual property of Ersi and is used herein under license. Copyright (c) Esri and its licensors.
The Bad River in Wisconsin is situated on tribal land of the Bad River Band of the Lake Superior Tribe of the Chippewa Indians, 106 km east of the Saint Louis River, and was chosen as a nearby, analogous Lake Superior tributary to serve as a geomorphic and ecological reference to the SLRE. The Bad River has no known point sources of industrial contamination, is subject to similar seiche dynamics, and has similar plant, invertebrate, and fish communities to SLRE (Great Lakes Coastal Wetland Monitoring Program, 2016).
2.2. Collection methods
Sediment and biological samples were collected within five major regions of SLRE and two regions of the Bad River in August 2017 (Fig. 1). The SLRE regions consisted of areas near Boy Scout Landing (termed Boyscout), Spirit Lake, Superior Bay, Allouez Bay, and Saint Louis Bay including Howards Bay. Two more intensely contaminated sites within SLRE, Ponds behind Erie Pier (of Saint Louis Bay) and Munger Landing (of Spirit Lake), were also sampled for sediments in a later field effort in August 2019. Within the Bad River estuary, sites were either classified as riverine, dominated by tributary discharge and exposed to periodic seiche influence, or as Bad River Slough, an expansive coastal wetland connected to the river but with limited water exchange with the Bad River. Sampling within each region (e.g. Superior Bay) was conducted at 6–8 locations that were selected using a Generalized Random Tessellation Stratified (GRTS) survey design (Stevens and Olsen, 2004; Table S1, sediment sampling locations). The design was chosen with both geomorphic (e.g. wetland coverage, embayment, or slough zones) and hydrologic considerations (e.g. seiche mixing) to define analogous regions between the two rivers: (1) the upstream Bad River compared to Boyscout and Spirit Lake, (2) the Bad River seiche mixing zone compared to the mixed zone of Saint Louis Bay and Superior Bay, and (3) Bad River Slough compared to Allouez Bay.
Sediments, waters, and biological matrices were collected using trace-metal clean techniques. Sediments were collected using a polypropylene core tube and the top 0–4 cm interval was extruded into clean polypropylene jars, bagged, and stored frozen until processing. Long cores (2 m) were collected at four locations with Howards Bay to assess historical Hg contamination and establish an isotopic endmember for industrial Hg within SLRE (SI Methods). Large volume water samples (15 L) were collected at central locations within Spirit Lake, Saint Louis Bay, and Boyscout, as well as from two upstream Saint Louis River sites and the Bad River at Copper Falls. Water samples in 2017 were collected during baseflow conditions (e.g. no flood events over 20,000 cfs) to capture typical conditions within SLRE, though it is noted that the system is subject to high waters during flooding and snowmelt that are not characterized in these samples. Water was filtered using a high capacity capsule filter (0.45 μm, Geotech) and preserved with 0.2% nitric acid (HNO3) until isotope analysis. A subsample of raw water was collected for concentration and was filtered to preserve filter-passing and particulate Hg; filtered subsamples were stored in 1% hydrochloric acid (HCl) and filters were frozen until analysis.
Three types of invertebrate samples were collected: dragonfly nymphs (Anisoptera, as a bioindicator), mixed benthic invertebrate composites, and riparian spiders. Dragonfly nymphs were collected using a D-net while mixed benthic invertebrates (predominantly isopods, amphipods, chironomids, and trichoptera) were collected by Hester-Dendy artificial substrate samplers that were positioned on moorings immediately above the sediment surface (8-week colonization period). Long jawed spiders (Tetragnathidae) were collected from emergent and riparian vegetation near the water surface using previously established methods (Kraus et al., 2017). Long jawed spiders are obligate riparian taxa, specialized predators of aquatic insects, and are increasingly used as sentinels for the transfer of aquatic bioaccumulative contaminants to the terrestrial environment (Ortega-Rodriguez et al., 2019, Walters et al., 2008). Samples were co-located, limiting the collection of dragonfly nymphs to within 100-m and the search for riparian spiders to within 500-m of the benthic invertebrate sample. Invertebrate samples were composited by site to a minimum mass of 1 g wet tissue. All composites were stored in clean plastic cups, and frozen until processing and analysis.
Fish were collected from the SLRE and Bad River regions via gill nets, fyke nets, otter trawl, or electrofishing. Multiple species of fish were targeted, with a goal of ten samples per region per species or species group: two prey fish groups, mixed shiners (Emerald Shiner-Notropis atherinoides, Spottail Shiner- Notropis hudsonius, Golden Shiner-Notemigonus crysoleucas; 1–25 whole fish per composite by size) and small Yellow Perch (Perca flavescens; 75–150 mm total length, 2–3 whole fish per composite), and two game fish, Walleye (Sander vitreus) and Northern Pike (Esox lucius), which were analyzed individually (fillets). Fish were measured (total length, ±1 mm; wet weight, ± 1 g) in the lab, and composites and fillets were stored frozen until processing.
2.3. Mercury Analysis
Concentration analyses for HgT and MeHg were performed by either the U.S. Geological Survey (USGS) Mercury Research Lab (MRL, Middleton, Wisconsin) or the USGS Contaminant Ecology Research Lab (CERL, Corvallis, Oregon). All sediment, water, invertebrates, and fish samples were lyophilized and homogenized prior to analysis. A brief description of analytical procedures used for this study is given here, but detailed descriptions of the methods and materials are provided elsewhere: https://wi.water.usgs.gov/mercury-lab. Total mercury (HgT) in sediments was determined using thermal decomposition coupled to cold vapor atomic absorption spectrophotometry (CVAAS) (U.S. EPA, 1998). Waters were oxidized with bromine monochloride (BrCl) and analyzed via stannous chloride reduction coupled to cold vapor atomic fluorescence spectrometry (CVAFS) (U.S. EPA, 2002). Isotope dilution methods were used to determine MeHg concentrations in sediments and waters. Briefly, an isotopic amendment of enriched Hg isotope was added to the sediment prior to distillation pretreatment (U.S. EPA, 2001). Distillates were then derivatized with sodium tetraethylborate and analyzed via gas chromatography coupled to an inductively coupled plasma mass spectrometer (ICP-MS) (Lepak et al., 2015b).
Prey fish composites and invertebrate samples were analyzed for MeHg using a 4.5 N HNO3 extract, heated for 8 hours at 55°C (Hammerschmidt and Fitzgerald, 2006) and analyzed using ethylation coupled to gas chromatography and CVAFS. After samples passed quality control measures (duplicates <10%, certified reference materials (CRM) 90–110% recovery for International Atomic Energy Agency [IAEA] 407 and IAEA 452) for MeHg concentration, the corresponding extracts were oxidized for HgT analysis. Extract oxidation entailed exposure to UV light (1 week) followed by the addition of BrCl (10% v/v). HgT extracts were analyzed via stannous chloride reduction coupled to gold amalgamation and CVAFS analysis (U.S. EPA, 2002). A subset of game fish fillets was analyzed for MeHg and HgT via acid extraction (n = 22); the remainder were analyzed for HgT only using thermal decomposition coupled to CVAAS. Detailed description of quality control protocols, including CRMs, can be found in the SI Methods. All raw data can be found in the corresponding USGS data repository (Janssen, 2020).
2.4. Mercury Isotope Analysis
All Hg isotope measurements were performed by the USGS MRL. Sediment, invertebrate, and fish samples were acid digested (90 °C for 8–10 hr) prior to isotope analysis. Aqua regia solution (3HCl:HNO3) was used for sediments while fish were treated with concentrated HNO3 followed by a BrCl addition (10% v/v) (Lepak et al., 2015a). Due to low concentrations and limited biomass from many of the sub-sites, only one mixed benthic invertebrate composite was analyzed from each region. All digests were diluted prior to isotope analysis (<10 % acid and 0.5–1.2 ng mL−1 Hg). CRMs used for sediment (IAEA SL-1 = 132.6 ± 6.4, 102% average recovery, n = 9), fish (IAEA 407 = 217.8 ± 10.2, 98 % average recovery, n = 36), and invertebrates (IAEA 452 = 151.9 ± 5.9, 95 % average recovery, n = 5) had acceptable concentration recoveries. Organic matter in waters was oxidized with 0.1% sodium persulfate followed by oxidation with BrCl (1%), after which samples were pre-concentrated using an AG1-X4 resin (Chen et al., 2010). Capsule filters containing suspended particulate matter were removed from the plastic housing, digested in 30 % BrCl, and preconcentrated for isotope analysis; further information is provided in SI Methods. Recoveries from preconcentration methods were calculated by comparing the amount of Hg within the sample to the amount recovered post-processing and yielded acceptable values for waters (99.5 ± 3.7 %, n = 6) and filters (96 ± 6.2 %, n =6).
Mercury isotope analysis was performed using a multicollector inductively coupled plasma mass spectrometer (MC-ICP-MS, Thermo Scientific Neptune Plus). Solutions were introduced using stannous chloride reduction coupled to a custom-designed gas liquid separator (Yin et al., 2016a). Thallium (40 ng mL−1) was used for mass bias correction during analysis and was simultaneously introduced into the gas liquid separator as an aerosol using an Apex-Q desolvating nebulizer. The MC-ICP-MS was tuned for optimal signal strength and stability (1v Hg202 ∼ 1 ng mL−1 of Hg). Mercury isotopes were analyzed following standard sample bracketing protocol (Blum and Bergquist, 2007) using the National Institute of Standards and Technology (NIST) 3133 Hg standard. Data were calculated in delta notation according to convention (Blum and Bergquist, 2007), in which δxxxHg represents mass dependent fractionation (MDF) and ΔxxxHg represents mass independent fractionation (MIF) (SI methods). Secondary standard NIST RM 8610 was analyzed at minimum every 5 samples to ensure accuracy and precision of isotope values (δ202Hg = −0.53 ± 0.07, Δ199Hg = −0.02 ± 0.05, Δ200Hg = 0.01 ± 0.04, 2SD, n = 187) and agreed with certified values. Additionally, CRMs were analyzed within every sample batch (approximately every five samples) to ensure digest efficiency (Table S2). Both the secondary standard and the certified reference materials produced values in agreement with published literature (Blum and Bergquist, 2007; Estrade et al., 2010; Lepak et al., 2018). External reproducibility and accuracy of isotope sample measurements is reported as 2SE of the NIST RM 8610 standard (0.01) and uncertainty in sample isotope composition is represented by 2SD of the corresponding CRM. All raw isotope data and quality control standards can be found in the corresponding USGS data repository (Janssen, 2020).
2.5. Carbon and Nitrogen Isotope Analysis
Carbon (C) and nitrogen (N) stable isotope analysis was conducted at the Great Lakes Toxicology and Ecology Division laboratory in Duluth, Minnesota. Dried (50° C for >24 hr), homogenized fish samples were weighed into a tin capsule and analyzed with a Costech 4010 Elemental Analyzer, coupled to a Thermo Delta Plus XP isotope ratio mass spectrometer. Data are reported in ‰ notation with Vienna Pee Dee Belemnite and air as standards for δ13C and δ15N, respectively. Analytical error, based on the 1SD of replicate lab standards, was ±0.1‰ for both δ15N and δ13C. Because increased lipid content causes a negative bias in δ13C values, values were corrected for lipid content using a mass-balance approach based on fish tissue C:N molar ratio (Hoffman et al., 2015b; C:N range for Walleye: 3.1–4.9; Northern Pike: 3.6–4.0; Yellow Perch: 3.9–5.0; shiners: 3.9–5.9). All C and N isotope can be found in the corresponding USGS data repository (Janssen, 2020).
2.6. Calculations and Statistical Analysis
Biological Hg concentrations for fish and invertebrates are reported in wet weight (ww). Concentrations for Walleye and Northern Pike are normalized to standard lengths based on a species-specific weighted average approach where 40 cm and 55 cm total length are used, respectively (Monson, 2009). Shapiro-Wilk tests showed that parameters such as HgT, Δ199Hg, and δ202Hg were not normally distributed (p < 0.05) in prey items, hence Spearman rank correlations were performed to assess relations between Hg, C, and N isotopes as well as biological metrics. Correlations are reported using Spearman rho and significance levels of 0.001, 0.001, 0.05, and 0.10. Statistical comparisons of prey and game fish concentrations were performed using a nonparametric Mann-Whitney test at a significance level of 0.05.
Regressions for photochemical slopes of Δ199Hg and Δ201Hg, testing the linearity and strength of relation, were performed using the York model to account for x and y error. These regressions were performed on sediments and biota separately to test which photochemical processes created Δ199Hg in each compartment. These tests confirmed that photochemical demethylation was responsible for the Δ199Hg measured in biota thus allowing for photochemical corrections to be performed. Comparison of Hg isotope data in prey items (benthic invertebrates and fish) was performed using a photochemically corrected term to account for photochemical demethylation of MeHg in the water column prior to bioaccumulation (Gehrke et al., 2011). This is necessary because the extent of photochemical demethylation is temporally, seasonally, and spatially variable, thus making it challenging to compare Hg sources in biota directly. This mathematically determined value, δ202HgCOR, was calculated for all prey items within the SLRE and Bad River using laboratory derived relation between δ202Hg and Δ199Hg at 10 mg L−1 dissolved organic carbon:
| (Eq.1) |
where δ202HgCOR = δ202Hg corrected for the photodemethylation effect, and 4.79 is the slope (Δ199Hg /δ202Hg) associated with photodemethylation (Bergquist and Blum, 2007). While game fish Hg isotope results can also be affected by photochemical demethylation, the correction was not utilized given the large amount of variability in dissolved organic carbon between riverine and lake conditions which alters the slope of Δ199Hg /δ202Hg. Thus, this correction was only performed on local prey items that rarely migrate into Lake Superior.
For sediments, two mass balance approaches were utilized and averaged to determine source contributions. These included one method accounting for precipitation adapted from Lepak et al. (2015a) and a binary source (industrial and watershed) approach with and without the inclusion of organic matter (SI methods). The average uncertainty between these calculations was 14%. Endmember points were selected from this dataset based on isotopic maximums or minimums, Hg concentration, and site history (SI methods). Howards Bay was selected as the industrial endmember (δ202Hg −0.29 ‰ and Δ199Hg = 0.001 ‰) and the Bad River was selected for watershed Hg (δ202Hg −1.35 ‰ and Δ199Hg = −0.23 ‰); both endmembers were used for source attribution in SLRE sediments. The precipitation endmember was referenced from Great Lakes precipitation values (δ202Hg = −0.88 ‰ and Δ199Hg as 0.42 ‰) which accounted for a 0.40 ‰ shift in δ202Hg due to sorption (Lepak et al. 2015a). Detailed information regarding the selection of endmembers and limitation to each method are detailed in the supporting methods.
Within game fish (Walleye and Northern Pike), the percentage of Lake Superior diet contribution was calculated using δ13C and δ15N mass balance mixing model (Phillips and Gregg, 2001). Endmembers for δ13C and δ15N for game fish diet contributions were defined based on prey items within three regions of SLRE (upper estuary, lower estuary, and Lake Superior) and three regions of the Bad River (Bad River-riverine zone, Bad River Slough, and Lake Superior). A four source MixSIAR model was also investigated for this data set and showed similar % Lake Superior contributions when compared to the Phillips and Gregg three source model (2001). Higher SD was observed with the MixSIAR model and was likely attributed to the addition of the Superior Bay fourth source and the Bayesian approach to error calculation (SI Methods). The three-source mixing model was chosen because it captured the isotopic character of the system and is in line with past studies of the SLRE (Hoffman et al. 2010, Hoffman et al. 2015a). Additional information regarding the mixing models used for sediment source contributions and game fish dietary contributions can be found in the SI methods.
3. Results & Discussion
3.1. Establishing the Presence of Legacy Hg in SLRE
Total Hg concentrations in the upper 0–4 cm of sediment of main river sites (excluding remedial zones) within the SLRE ranged from 18.2 to 675 ng g−1 and were on average 10 times higher than the chosen reference site the Bad River (1.50 to 34.4 ng g−1) and 6 times higher than the Bad River Slough (19.5 to 100 ng g−1), a region with increased wetland coverage (Fig. 1a, Fig. S1, Table S3). These concentrations within SLRE were accompanied by an equally large range of δ202Hg values from −0.35 to −1.33 ‰. In some cases, these SLRE sediments overlapped with δ202Hg values measured in the Bad River system (range −0.96 to −1.35 ‰), mostly reserved to the SLRE Boyscout, Spirit Lake, and Allouez Bay regions (Fig. 2). Variation in other Hg isotope tracers were also observed throughout SLRE sediments including negative Δ199Hg values in Spirit Lake and Allouez Bay (−0.11 to −0.17 ‰) as well as positive Δ200Hg values in Superior Bay (Table S3). Previous investigations have shown that negative Δ199Hg values are linked to atmospheric gaseous elemental Hg deposition on foliage and soils in the terrestrial environment of the region (northern Wisconsin, Demers et al., 2013), whereas measurements of positive Δ200Hg values indicate that some proportion of Hg is directly linked to precipitation, as observed in previous work (Gratz et al., 2010; Sherman et al., 2015). The range in δ202Hg values in sediments within SLRE suggests a complex mix of multiple coexisting Hg sources that include legacy Hg as well as continuing inputs from contemporary sources from through the watershed (evidenced by – Δ199Hg) and the atmosphere (evidenced by + Δ200Hg). However, it is noted that further studies are needed at a finer spatial to resolve whether each of these Hg inputs are equally susceptible to Hg methylation.
Fig. 2.

Mercury stable isotope ratios (δ202Hg) in SLRE and Bad River surficial sediments (0–4 cm) as a function of log transformed Hg concentration (HgT). Sediments within the study regions show a continuum between regional background Hg, defined by the Bad River, and industrially influenced sediments, such as sediment hotspots in Erie Pier Ponds and Howards Bay. A subset of sediments from Allouez Bay and Bad River Slough deviate from gradient, likely due to higher organic matter content which acts as a sink for Hg within these regions. Error bars represent the 2SD of isotope measurements performed on certified reference material IAEA SL-1.
Sediment δ202Hg values had distinct differences that allowed for the designation of end members and thus determination of Hg source loading to different regions within SLRE. The common characteristics for legacy impacted sediments have been discussed previously (Eckley et al., 2020) and the rationale for these selections were briefly covered in the methods section. Expanding upon that, the highest Hg concentrations (220–6860 ng g−1) were observed in regions of current or proposed remedial activity and produced δ202Hg values ranging from −0.18 to −0.70 ‰ in Howards Bay, Saint Louis Bay, Erie Pier Ponds, Munger Landing, and Superior Bay (Fig. 2). In particular, Hg contamination was most severe and most temporally and spatially consistent within the Saint Louis Bay region of Howards Bay (as evidenced by the cores, Fig. S2). The Howards Bay region has historical metal contamination and was isotopically similar to legacy Hg at other industrially contaminated sites (Eckley et al., 2020), making it an ideal endmember for industrial Hg within SLRE (Fig. 2). The collection of sediments from Erie Pier Ponds and Munger Landing was performed in a second round of sampling in 2019, however it was expected that these off-channel remedial sites would have temporal stability within sediments as was observed in the Howards Bay core. Therefore, the Hg sources for these sites were also calculated using the sediment source attribution model.
Lower concentration sediments had lower δ202Hg values, as best illustrated in the Bad River as a reference for watershed-derived Hg (Fig. 2). The lack of industrial activity in the Bad River, coupled to negative δ202Hg and Δ199Hg values, supports the conclusion that Hg at this site is derived from atmospheric deposition of gaseous oxidized Hg species and the foliar uptake of gaseous elemental Hg (Demers et al., 2013) that were incorporated into litterfall and soil reservoirs prior to being washed into the river. For this reason, the Bad River adequately represents background watershed conditions for both rivers. With these two endmembers established (industrial Hg and watershed Hg) plus that described in the methods for precipitation delivered Hg (Lepak et al., 2015a), tertiary and binary mixing models were developed to determine the relative contributions of the three Hg sources (Fig. 1b, Fig. S3, Fig. S4). Twenty-two percent of the locations within SLRE had significant amounts industrially sourced Hg (>50 % of the total source). These locations were heavily focused in regions of Saint Louis Bay, Superior Bay, and Munger Landing (of Spirit Lake)- areas where most historical industrial activity occurred (Fig. 1b, Fig. S3). Notably, sediment samples distant from direct legacy inputs, such as within the Boyscout region, had a large contribution of industrial Hg with two sites showing 44 and 53% industrially derived Hg. Watershed sources dominated Allouez Bay and non-remedial zones of Spirit Lake, two locations with noted sediment delivery from local non-industrially affected streams (Bluff Creek and Little Pokegama River, respectively) (Fig. 1b, Fig. S3). The average influence of precipitation to these sediments was < 15 %, with larger contributions only observed in regions directly adjacent to Lake Superior such as Allouez and Superior Bays. The widespread presence of industrial Hg within SLRE may be attributable to the combined mixing forces of regular seiches, high water discharge during snowmelt and summer storms, and infrequent storm surges of Lake Superior water. As a result, SLRE is a well-mixed system and over time has dispersed the industrial Hg across the ecosystem, including areas outside targeted zones of contamination and current remedial efforts (Fig. 1). Furthermore, industrially sourced Hg is likely present in regions of enhanced Hg methylation, such as fringing coastal wetland habitat, making this a potential concern for bioaccumulation. Mapping these sedimentary Hg sources provides context to test whether the Hg isotope values of water, invertebrates, spiders, and fish are comparable over these dynamics systems.
The exchangeability of sediment and aqueous phase Hg is highly understudied from a Hg isotope perspective, but it is generally understood that particle-bound Hg and dissolved Hg do not share similar Hg isotope values. Further, suspended particles can originate from external outputs, resuspended sediments, or in situ primary productivity, each of which presents novel opportunity for exploration and inference. In SLRE, despite the prevalence of industrial Hg within sediments industrially derived Hg isotope values are not found within filter-passing Hg. A subset of water samples collected upstream and within SLRE showed HgT was predominantly in the filter-passing form (1.84 ± 0.56 ng L−1, n = 5) rather than particulate (0.72 ± 0.49 ng L−1, n = 5) (Table S4). The higher concentrations of Hg within the filter-passing phase are likely attributed to the low amount of suspended particulate matter in the water column and high dissolved organic carbon (DOC) content within waters of SLRE, which reached values up to 21.9 mg L−1 (Table S4). The δ202Hg values of filter-passing Hg in these waters ranged from −1.05 to −1.15 ‰ and were similar to Bad River water (−1.32 ‰) (Fig. S5). Aqueous filter-passing Δ199Hg values were between 0.37 and 0.68 ‰ indicating photochemical degradation of Hg species during transport through the watershed which was not observed in sediment samples. Isotope values for SLRE were more positive in δ202Hg and Δ199Hg than previous studies (Woerndle et al., 2018, Tsui et al., 2020b), which were attributed to higher potential for photochemical processing in upstream reservoirs for upstream sites and Lake Superior influence in the lower estuary. Water from the Bad River was collected outside of the seiche mixing zone and aligns with literature values that were attributed to gaseous elemental Hg deposition on surrounding watersheds (Woerndle et al. 2018, Tsui et al. 2020b). These observations indicate that Hg in filtered water is delivered from watershed runoff of Hg associated with DOC, but in SLRE due to sampling location and upstream impoundments photochemical fractionation is more pronounced.
The suspended particulate matter from SLRE displayed lower δ202Hg values (−0.45 to −0.76 ‰) and near zero Δ199Hg values, suggesting that the source of Hg on particulates was distinct from both filter passing Hg in SLRE and particulate matter in the Bad River ( δ202Hg = −1.26 ‰; Δ199Hg = −0.26 ‰) (Fig. S5). Given the similarities between the isotopic composition of suspended particulate matter and sediments from SLRE coupled to the mixing forces present in the lower estuary, particulate-bound Hg likely reflects Hg from sediment resuspension within the system. While adsorption and desorption between the dissolved and particulate-bound Hg phases can affect δ202Hg, these reactions have not been shown to change Δ199Hg (Blum et al., 2014). Particularly for SLRE, there are no known series of reactions that can fractionate Hg to connect the sediment Hg isotope values to those in water. This suggests there is a disconnect between the sources and processing of Hg in suspended particulate matter and filter-passing Hg (Fig. S5), the latter of which is presumably derived from upstream watershed runoff and precipitation. Hence in lower portions of the estuary there is likely little exchange between filter-passing Hg derived from upstream watershed sources and Hg sequestered in sediments, which can be an important distinction for Hg entry into the food web.
3.2. Bioaccumulation of Hg in the Lower SLRE Food Web
Common aquatic insects and demersal fishes within SLRE have a high dependence on benthic organic matter (Hoffman, 2010), leading to a concern that legacy contamination in sediments and particulate matter can cause elevated Hg levels within the food web. HgT concentrations increased from mixed benthic invertebrates (10.3 ± 3.6 ng g−1 ww, n = 22) to dragonfly nymphs (34.5 ± 10.5 ng g−1 ww, n = 25) to riparian spiders (175 ± 70.9 ng g−1 ww, n = 59) across SLRE (Fig. S6). All benthic invertebrate samples were on average > 80% (range 83-104%) MeHg except for the mixed benthic invertebrates that varied owing to differences in colonizing taxa (Table S5). Interestingly, HgT concentrations in shiners (55.5 ± 32.0 ng g−1 ww, n = 49) and Yellow Perch (52.1 ± 12.4 ng g−1 ww, n = 27) were lower than riparian spiders despite potential similarities in diet (i.e., aquatic insects). Previous work has demonstrated that metamorphosis can result in the increase of MeHg within adult insects compared to their larvae in oligotrophic conditions (Chételat et al., 2008), potentially accounting for high concentrations in spiders that feed on adult insects, though this has not been demonstrated in mesotrophic environments similar to SLRE (Kraus et al., 2014). Concentration differences can also arise from shifts in diet, food availability, and metabolic rates between fish and spiders, making it difficult to thoroughly compare these aquatic and terrestrial consumers.
When Hg concentrations from SLRE biota were compared to the Bad River, the same relative pattern was observed between organisms, but with comparable or higher concentrations in the Bad River. Concentrations in mixed benthic invertebrates (14.4 ± 4.30 ng g−1 ww, n = 15) and dragonfly nymphs (33.9 ± 13.0 ng g−1 ww, n = 15) were comparable to samples collected within SLRE, whereas riparian spiders (184 ± 91.9 ng g−1 ww, n = 15) were slightly (albeit not significantly) higher in HgT (Fig. S6). In contrast, concentrations in shiners (75.7 ± 21.4 ng g−1 ww, n = 15) and Yellow Perch (71.6 ± 30.0 ng g−1 ww, n = 22) were significantly higher in the Bad River in comparison to SLRE (p < 0.05, Mann-Whitney test, Fig. S6), despite analogous collection zones and similar composite size ranges (Table S5). It is not uncommon to observe higher concentrations of bioaccumulated Hg in sites such as the Bad River, even when Hg concentrations are low in sediments (Eagles-Smith et al., 2016). It has been observed that newer depositional sources of Hg to the environment are more readily methylated, allowing for enhanced bioaccumulation (Harris et al., 2007), and that regions of urbanization are not conducive to methylation, due to a lack of organic carbon and appropriate terminal electron acceptors (Chalmers et al., 2014). The physical features of the lower SLRE (Saint Louis Bay and Superior Bay), including armored banks and lack of wetland regions, may contribute to a decrease in Hg methylation potential. Additionally, DOC concentrations in the SLRE are nearly twice that of the Bad River (Table S4), and may cause a mitigating, competitive-ligand effect on Hg and MeHg trophic transfer (Lee and Fisher, 2017) and affect concentrations in higher trophic level biota (Tsui and Finlay, 2011 ,French et al, 2014). The differences in Hg concentrations in prey fish suggested that factors related to the sources or form of Hg available for methylation may play an important role in the concentration differences between the two systems.
Mercury isotopes were measured in biota to determine the Hg sources bioaccumulating into the food web and the GRTS sampling design allowed for the comparison of Hg isotope values between sediments, fish, and invertebrates across multiple aquatic conditions. The preservation of isotope signatures in biota differs from sediments, mainly due to the additional processes of methylation and water column photochemical demethylation (Fig. S7), the latter of which can induce changes in both Δ199Hg and δ202Hg (Bergquist and Blum, 2007) prior to bioaccumulation. Because the biota within this study ranged from benthic insects to prey fish, there was a large range of Δ199Hg values (Table S5) that did not allow for the direct comparison of δ202Hg values. Thus, values were compared using a photochemically corrected term, δ202HgCOR (Eq. 1) (Gehrke et al., 2011). δ202HgCOR values were comparable through these various food web compartments (Fig. 3). The comparison of invertebrates (whether dragonfly nymphs, mixed benthic invertebrates, or riparian spiders) and prey fish showed a positive, linear relation (r2 = 0.60, Fig. S8), indicating similar Hg sources were accumulating within a capture location. Riparian spider δ202HgCOR values aligned well with aquatic biota in most sites, though some isotopic deviations were observed in regions removed from industrial activity, such as Allouez Bay and the Bad River (Fig. 3). Within these regions, riparian spider δ202HgCOR values were lower than the corresponding dragonfly nymphs and prey fish, which may relate either to physiological differences that could impart fractionation (e.g. internal partitioning, molting) or dietary differences disconnecting them from aquatic Hg sources in regions with less urbanization and greater wetland area. A previous investigation showed that Hg isotope values in spiders can vary based on prey selection (Tsui et al., 2012), and that the negative values in specific regions of SLRE and the Bad River may be attributed to incorporation of terrestrial prey items. Further investigation is needed to examine the transport of aquatic sources of industrial Hg to terrestrial insects and avian species, but these results indicate Hg within the aquatic and terrestrial food webs are connected in SLRE.
Fig. 3.

Comparison of δ202HgCOR for mixed benthic invertebrates (dashed line), dragonfly nymphs (open box), riparian spiders (lined box), and prey fish (filled box) for SLRE and the Bad River. Sample counts are denoted on the x axis under the corresponding boxplots; mixed benthic invertebrate samples are n = 1 per region. Boxplots describe the 25–75% percentile, whiskers denote 1.5 interquartile range, median values are marked as the inner line of the box, and average is denoted by the square symbol.
3.3. Ecological Controls on Hg Isotopes in Prey Fish
While Hg sources to SLRE biota were well-conserved between the aquatic and terrestrial food webs, it was unclear if a Hg source was legacy-derived or from contemporary atmospheric sources, further fractionated due to ecological processes. An organic matter gradient develops within the SLRE river-lake transition zone due to carbon mineralization processes and urban influents in the lower harbor, creating a well-characterized δ13C and δ15N isoscape that allows for fish movement to be traced (Hoffman et al., 2010). Estuarine environments commonly support a range of ecologically defined feeding habitats that are isotopically distinct based on the δ13C signatures of dissolved inorganic carbon (DIC), commonly described with a conservative mixing model (Fry, 2002). SLRE has a gradient across the river-lake transition zone owing to the mixing of 13C-depleted DIC sources from upstream mixing with 13C-enriched DIC from Lake Superior that is conserved in the food web in both primary producers and primary consumers (Hoffman et al., 2010). Whether this gradient influences Hg cycling and therefore Hg isotopes measured in fish is unknown. Prey fish exhibited the same δ13C pattern such that fish captured upstream, in both SLRE and the Bad River, had more negative values than fish collected at sites downstream closer to Lake Superior (Fig. 4). This general gradient of δ13C signals in prey fish is associated with the variation observed in δ202HgCOR (Fig. 4); a significant correlation between δ13C and δ202HgCOR was observed within shiners and Yellow Perch from SLRE (Spearman rho = 0.55, p< 0.01, rho = 0.38, p < 0.10) and the Bad River (Spearman rho = 0.67, p < 0.10, Table S6). In addition, among SLRE Yellow Perch there are positive correlations between δ202HgCOR and either length (Spearman rho = 0.51, p < 0.01) or δ15N (rho = 0.45, p < 0.05) that indicates Hg isotope values in Yellow Perch are influenced by ontogenetic diet shifts (Table S6) (Wu and Culver, 1992). These results point to a habitat effect on Hg isotope ratios in both the SLRE and Bad River that could be related to the mixing of Hg sources closer to Lake Superior or source-specific dynamics that influence δ13C values, both of which warrant further examination.
Fig. 4.

Isotope biplot of δ202Hgcor and δ13C for prey fish (shiners and Yellow Perch) in SLRE (blue colors) and the Bad River (orange colors). The solid orange line is the slope of the linear regression for Bad River prey fish (y = 0.019 x – 0.038, r2 =0.53, n = 37). The solid blue line is the linear regression for SLRE and Bad River Slough prey fish (y = 0.019 x −0.014, r2 = 0.15, n = 74), which had a weaker regression coefficient. These lines are proxies for the habitat related Hg isotope shift that occurs within these estuaries. Error bars represent the 2SD of isotope measurements performed on certified reference material IAEA-407.
The habitat shift did not explain all the isotopic differences between the systems, specifically the negative δ202Hg values observed in invertebrates and prey fish from the Bad River (Fig. 3). Prey item δ202HgCOR values from the Bad River averaged −0.92 ± 0.20 ‰ (n = 68), including all invertebrates and prey fish, in comparison to those from SLRE, −0.63± 0.19 ‰ (n = 159). The δ202HgCOR average values between the two rivers are significantly different (p < 0.05) with a 0.29 ‰ offset, effectively creating a different starting baseline prior to any habitat driven shifts within the rivers (Fig. 4). The only samples from the Bad River absent of this “source” shift were prey fish from the Bad River Slough (Fig. 4). The slough is an anomalous case within this study because prey fish from the region had distinct δ13C values (−33.3 to −38.2 ‰, n = 14), attributed to the wetland character of the system that was not represented in the analogous habitat of Allouez Bay. This resulted in an overlap causing the Bad River Slough to resemble upstream habitats within SLRE (e.g., Boyscout), suggesting the possibility that a wetland endmember could be responsible for the higher δ202Hg values in prey fish from SLRE. If MeHg produced in highly productive wetland regions of SLRE was the major source to biota, there could be an altered MeHg isotope baseline between the systems due to fractionation during methylation (Janssen et al., 2015). However, if isotope values from Bad River Slough were the starting isotopic composition representative of a wetland region, even the maximum isotope shift related to the C habitat gradient between SLRE and Lake Superior could not account for the higher δ202Hg values observed throughout SLRE (blue line, Fig. 4). Furthermore, the highest δ202HgCOR values observed in SLRE prey fish were from regions of Saint Louis Bay and Superior Bay, regions of heavy legacy contamination within the sediments and less wetland character along the shorelines.
The offset of SLRE and the Bad River in Figure 4 suggests that food web isotope shifts between the rivers relate to underlying Hg source differences. The lower δ202Hg, δ202HgCOR and Δ199Hg in biota of the Bad River when compared to the higher ones in SLRE had similar direction and magnitude to those observed in sediments. The mixing models showed that atmospheric precipitation sources were a minor component of sediment Hg. Like the sediments, precipitation delivered Hg is only a marginal contributor to the Hg burden in invertebrates and prey fish, because only 13% of prey fish had measurable Δ200Hg (≥ 0.06 ‰, threshold of measurement error). This observation indicates the prominent sources to SLRE biota were watershed- and industrial-derived Hg, which likely resulted in the dilution of measurable Δ200Hg signals within the tissue. Within SLRE, this demonstrates that industrial Hg, a major and ubiquitous source within the system, causes the elevation in δ202HgCOR within prey fish (Fig. 4). Given that prey fish δ202HgCOR values overlapped with mixed benthic invertebrates as well as riparian spiders (Fig. 3), this suggests that legacy Hg is bioaccumulating in the aquatic food web and the terrestrial food web surrounding SLRE. However, even though Hg isotope values indicate industrial Hg is accumulating within the food web of SLRE, HgT concentrations were not significantly elevated in comparison to the reference location. Factors in SLRE such as DOC mitigating trophic transfer, less suitable conditions for methylation in the lower estuary, and potentially a more recalcitrant industrial Hg substrate for methylation may contribute to the lower fish Hg concentrations in comparison to the Bad River. Further investigation is needed to assess intricacies of spatial drivers on methylation and the extent of industrial contamination in wetland regions of SLRE, but this work suggests that sediment HgT concentrations are not the limiting factor driving bioaccumulation through the food web.
3.4. Mercury Source Tracing as Revealed by Migratory Fish Species
High Hg burdens to game fish species within the SLRE are the basis for fish consumption advisories, and an overarching goal of current remediation efforts is to reduce Hg concentration in game fish to achieve higher safe fish consumption rates. In addition, migratory species that utilize the estuary for spawning or nursery habitat also introduce the potential of transporting contamination within SLRE to the Lake Superior food web. Two species of game fish were targeted, Walleye and Northern Pike, to encompass both migratory and resident fish, respectively. On average Walleye and Northern Pike from SLRE had HgT concentrations twice as high as those from the Bad River, though a large range did exist (130–996 ng g−1 ww, Table S7). Furthermore, it was determined that 60% of Walleye (34 individuals) from SLRE, but only two individuals from the Bad River, exceeded the U.S. EPA recommended consumption limit of 300 ng g−1 (U.S. EPA, 2020). Northern Pike in SLRE were also found to have similar patterns with 55% (23 individuals) exceeding the U.S. EPA threshold. Interestingly, Northern Pike from the Bad River also displayed elevated HgT levels, with only one individual under 300 ng g−1. While these values are still on average lower than SLRE Northern Pike, it suggests that regions of the Bad River, specifically the slough, could be zones of enhanced methylation or more rapid bioaccumulation due to food web differences. This also further demonstrates that differences in habitat and dietary behavior between game fish can result in HgT concentration discrepancies within a system.
Within SLRE, HgT concentrations were highest at the upstream site, Boyscout (Northern Pike = 460 ± 118 ng g−1 ww, n = 4 and Walleye = 588 ± 219 ng g−1 ww, n = 11), and decreased downstream approaching Superior Bay (Northern Pike = 220 ± 64.2 ng g−1 ww, n = 8 and Walleye = 204 ± 78.9 ng g−1 ww, n = 9). This observation could be attributed to the large riparian zones that surround the upper estuary (Boyscout and Spirit Lake regions), providing carbon rich wetland zones that could promote Hg methylation (Beck and Johnson, 2014). In comparison, lower reaches of the estuary (Saint Louis Bay and Superior Bay) have less potential methylation zones due to the historical and ongoing industrial activity in the harbor (U.S. EPA, 2020). These observations did not align with prey items from SLRE that showed no defined site-specific patterns (Fig. S6). The disconnect between prey and game fish HgT concentrations could be attributed to physiological differences (e.g. age), exposure to different Hg sources, or site fidelity between species.
With respect to Hg isotopes, large and highly variable uncorrected δ202Hg values were observed for Walleye (0.26 ± 0.59 ‰, n = 55) and Northern Pike (0.33 ± 0.32 ‰, n = 42), with δ202Hg values well exceeding those of prey items (Tables S5). In addition, the lower 202Hg values attributed to watershed delivered Hg were observed in just a few Northern Pike from the Bad River and Allouez Bay, but not for Walleye (Table S7). Most of the δ202Hg variability was attributed to MDF from photochemical demethylation, which is also quantified by variability in Δ199Hg (range 0.20–5.80 ‰). High Δ199Hg values have been observed in game fish collected in offshore regions of Lake Superior due to enhanced photochemical demethylation in the water column (Lepak et al., 2018), but was not observed in any riverine prey items in this study. Positive Δ200Hg values (≥ 0.06 ‰, threshold of measurement error) were observed in 44 Walleye and Northern Pike across SLRE and the Bad River, accounting for 38% of the measured samples (Table S7), whereas similar values were only observed in 31 prey items, accounting for 13% of the total samples analyzed (Table S5). Positive Δ200Hg values have been attributed to Hg delivered from precipitation and may indicate a larger influence of precipitation for game fish that traverse between the estuaries and Lake Superior. Thus, the game fish Hg isotope ratios within SLRE and the Bad River introduce the exposure to a third offshore, more photochemically processed, source of Hg that was not observed in prey items of the estuary. The incorporation of an offshore precipitation sources is likely tied back to the migratory or foraging habits of these larger species (Madenjian et al., 2019), which also reduces the influence of exposure to sediment contamination in the river (Hoffman et al., 2020).
The migratory habits of larger fish species, specifically Walleye, can dictate which Hg sources an organism is exposed to and, to characterize this complexity, Hg isotope signatures would need to be examined with respect to dietary contributions. The maximum δ13C value in Walleye was −20.3 ‰, which is a 13C-enriched value associated with the Lake Superior nearshore benthic food web (Hoffman et al., 2015a), and there was a large proportion of Walleye with enriched 13C composition compared to prey items (Tables S5, S7). Mass-balance mixing models were constructed for Northern Pike and Walleye utilizing δ13C and δ15N values to assess the contribution of Lake Superior prey items relative to prey consumed from the lower estuary (Superior Bay, Saint Louis Bay) or upper estuary (Spirit Lake, Boyscout; Table S7). Based on the model results, Walleye and Northern Pike captured within SLRE have a large range of dietary contribution from Lake Superior (6% to 100%). Notably, capture locations for these fish did not dictate dietary contribution (Table S8). For example, Walleye captured from the Boyscout region had substantial Lake Superior diet contribution, reflecting recent movements.
These habitat-specific diet contributions were compared to δ202Hg, Δ199Hg, and HgT to assess Hg sources and associated bioaccumulation in Walleye and Northern Pike (Fig. 5). Walleye with a higher proportion of Lake Superior diet had higher δ202Hg and Δ199Hg values, confirming that enhanced photochemistry was an independent tracer of Lake Superior-derived Hg. Further, increasing dietary contributions of Hg from Lake Superior resulted in lower HgT concentrations in Walleye (Fig. 5a). These results also explained the lower concentrations observed in Walleye from the Bad River in comparison to SLRE that were heavily dependent on diet contribution from Lake Superior (i.e., they were migratory and not resident fish; Fig 5a). Northern Pike exhibit similar patterns to Walleye, but there was a lower dependence on Lake Superior Hg sources (Fig. 5b), presumably because Northern Pike are residents of the estuary, inhabiting wetland areas that are ideal for hunting and spawning (Casselman and Lewis, 1996). The δ202Hg values of Northern Pike were, on average, below 1 ‰ and matched the range of prey items between the SLRE and Bad River. Concentration patterns showed that Northern Pike with lower δ202Hg values, indicative of watershed Hg, yielded the highest concentrations (Fig 5b), which were associated with the Allouez Bay region in the SLRE and the Bad River. While Hg isotopes suggest that higher Hg concentrations are related to wetland regions, likely with higher net Hg methylation (Table S3), dietary contributions suggest a dependence on Lake Superior diet. This may be related to a limitation in the model endmembers to fully represent these coastal areas for Northern Pike, or to their foraging habits as ambush predators can consume highly diverse prey, and thus are more complex to model than Walleye. Game fish results highlight that multiple Hg sources contribute to fish HgT concentrations within SLRE, an important consideration for removal of fish consumption advisories for the region. Migratory fish, like Walleye, have little site fidelity (i.e. capture location does not reflect Hg source), making multi-isotope approaches useful in assessing future changes in fish Hg burdens in response to the removal of legacy contamination and sediment remediation in SLRE.
Fig. 5.

Mercury isotope biplot for (a) Walleye and (b) Northern Pike in relation to dietary contributions from Lake Superior and total mercury (HgT) concentrations (wet weight). Dietary contributions are represeted as green to blue for SLRE and orange to red for the Bad River. The size of the circle represents the HgT concentration in the sample. Error bars represent the 2SD of isotope measurements performed on certified reference material IAEA-407.
Conclusions
The use of multiple isotope approaches (Hg, C, N) allowed for in-depth examination of cycling and pathways of several different Hg sources to the SLRE, as well as complex dietary preferences to local fish populations. Sediments displayed well-defined sources of Hg, predominantly watershed and industrial Hg that were found to extend beyond boundaries of remedial and restoration zones in the river. The use of the Bad River as a reference site also allowed for the confirmation that SLRE sources were isotopically distinct from the background watershed signature and persisted within benthic invertebrates, prey fish, and spiders. Due to the ecological complexities of river-lake transition zones, dietary isotope tracers were used to further identify Hg isotope shifts related to habitat gradient within the river. However, this approach was unable to explain the elevated δ202HgCOR signatures further suggesting the influence of industrial Hg. Lastly, game fish were found to accumulate Hg from SLRE resulting in higher concentrations, but larger home ranges also introduced Hg sources from Lake Superior that needed to be accounted for using dietary models. Within SLRE, it is clear that industrial Hg inputs are present in sediments and actively bioaccumulating, though it is noted that this only results in elevated concentrations in game fish and not prey items of the estuary. Thus, industrial Hg from legacy contamination still poses risks to coastal zones within the Great Lakes. There are many areas like SLRE, both within the Great Lakes and worldwide, grappling with the management of Hg exposure risks given uncertainty regarding the bioavailability of legacy Hg. This study highlights the potential for applying isotopic tracers to better explore the effects of habitat restoration and remedial activity on Hg bioaccumulation within wetland and coastal habitats.
Supplementary Material
Acknowledgments
This work was funded through the U.S. Environmental Protection Agency Great Lakes Restoration Initiative and the U.S. Geological Survey Contaminant Biology program. The authors thank Graham Hanson, Tim Corry, Jim Lazorchak, Roger Yeardley, Meaghan Kern, Michael Hennesy, Leah Medley, Jon Barge, Mark Elliot, LaRae Lehto, Phil Monson, and Matt Steiger for field support in the collection of zooplankton, Hester-Dendy samplers, dargonflies, and fish within SLRE and the Bad River. Sediment and water collections were supported by Nathan Johnson, Amber White, and Marissa Kneer. The authors also thank the Bad River Band of the Lake Superior Tribe of Chippewa Indians for access to sampling locations within the Bad River. The authors also acknowledge Christopher Babiarz and Tylor Rosera for assistance with Hg analyses. Instrumentation at the USGS Mercury Research Lab was supported by the USGS Toxics Hydrology Program. Postdoctoral support was provided by the National Science Foundation Postdoctoral Fellowships for Research in Biology Collection Program 2018 (award no. 1812211). Any use of trade, firm, or product names is for descriptive purposes only and does not imply endorsement by the U.S. Government.
References
- Allan JD, McIntyre PB, Smith SDP, Halpern BS, Boyer GL, Buchsbaum A, et al. Joint analysis of stressors and ecosystem services to enhance restoration effectiveness. Proc Natl Acad Sci 2013; 110: 372. [DOI] [PMC free article] [PubMed] [Google Scholar]
- Andersen CR, Niemela S, Anderson J, Grayson S, Monson B, Christopherson D, et al. St. Louis River Watershed Monitoring and Assessment Report St. Paul, MN, 2013. [Google Scholar]
- Beck BF, Johnson NW. Geochemical factors influencing the production and transport of methylmercury in St. Louis River Estuary sediment. Appl Geochem 2014; 51: 44–54. [Google Scholar]
- Bellinger BJ, Hoffman JC, Angradi TR, Bolgrien DW, Starry M, Elonen C, et al. Water quality in the St. Louis River Area of Concern, Lake Superior: Historical and current conditions and delisting implications. J Great Lakes Res 2016; 42: 28–38. [Google Scholar]
- Bergquist BA, Blum JD. Mass-dependent and -independent fractionation of Hg isotopes by photoreduction in aquatic systems. Science 2007; 318: 417–20. [DOI] [PubMed] [Google Scholar]
- Blum JD, Bergquist BA. Reporting of variations in the natural isotopic composition of mercury. Anal Bioanal Chem 2007; 388: 353–359. [DOI] [PubMed] [Google Scholar]
- Blum JD, Sherman LS, Johnson MW. Mercury Isotopes in Earth and Environmental Sciences. Annu Rev Earth Planet Sci 2014; 42: 249–269. [Google Scholar]
- Casselman JM, Lewis CA. Habitat requirements of northern pike (Essox lucius). Can J Fish Aquat Sci 1996, 53:161–174. [Google Scholar]
- Chalmers AT, Krabbenhoft DP, Van Metre PC, Nilles MA. Effects of urbanization on mercury deposition and accumulation in New England. Environ Pollut 2014; 192: 104–112. [DOI] [PubMed] [Google Scholar]
- Chen J, Hintelmann H, Feng X, Dimock B. Unusual fractionation of both odd and even mercury isotopes in precipitation from Peterborough, ON, Canada. Geochim Cosmochim Acta 2012; 90: 33–46. [Google Scholar]
- Chen J, Hintelmann H, Dimock B. Chromatographic pre-concentration of Hg from dilute aqueous solutions for isotopic measurement by MC-ICP-MS. J Anal At Spectrom 2010; 25: 1402. [Google Scholar]
- Chételat J, Amyot M, Cloutier L, Poulain A. Metamorphosis in Chironomids, More than Mercury Supply, Controls Methylmercury Transfer to Fish in High Arctic Lakes. Environ Sci Technol 2008; 42: 9110–9115. [DOI] [PubMed] [Google Scholar]
- Demers JD, Blum JD, Zak DR. Mercury isotopes in a forested ecosystem: Implications for air-surface exchange dynamics and the global mercury cycle. Global Biogeocheml Cy 2013; 27: 222–238. [Google Scholar]
- [Dataset] DIVER. 2017. Web Application: Data Integration Visualization Exploration and Reporting Application, National Oceanic and Atmospheric Administration. Retrieved: [June 24 2020], from https://www.diver.orr.noaa.gov
- Eagles-Smith CA, Ackerman JT, Willacker JJ, Tate MT, Lutz MA, Fleck JA, et al. Spatial and temporal patterns of mercury concentrations in freshwater fish across the Western United States and Canada. Sci. Total Environ. 2016; 568: 1171–1184. [DOI] [PubMed] [Google Scholar]
- Eckley CS, Gilmour CC, Janssen S, Luxton TP, Randall PM, Whalin L, et al. The assessment and remediation of mercury contaminated sites: A review of current approaches. Sci Total Environ 2020; 707: 136031. [DOI] [PMC free article] [PubMed] [Google Scholar]
- Eckley CS, Luxton TP, Goetz J, McKernan J. Water-level fluctuations influence sediment porewater chemistry and methylmercury production in a flood-control reservoir. Environ. Pollut. 2017; 222: 32–41 [DOI] [PMC free article] [PubMed] [Google Scholar]
- Estrade N, Carignan J, Sonke JE, Donard OFX. Measuring Hg Isotopes in Bio-Geo-Environmental Reference Materials. Geostand Geoanal Res 2010; 34: 79–93. [Google Scholar]
- French TD, Houben AJ, Desforges J-PW, Kimpe LE, Kokelj SV, Poulain AJ, et al. Dissolved organic carbon thresholds affect mercury bioaccumulation in Arctic Lakes. Environ Sci Technol 2014; 48: 3162–3168. [DOI] [PubMed] [Google Scholar]
- Fry B. Conservative mixing of stable isotopes across estuarine salinity gradients: A conceptual framework for monitoring watershed influences on downstream fisheries production. Estuaries 2002; 25: 264–271. [Google Scholar]
- Fu X, Marusczak N, Wang X, Gheusi F, Sonke JE. Isotopic Composition of Gaseous Elemental Mercury in the Free Troposphere of the Pic du Midi Observatory, France. Environ Sci Technol 2016; 50: 5641–5650. [DOI] [PubMed] [Google Scholar]
- Gehrke GE, Blum JD, Slotton DG, Greenfield BK. Mercury isotopes link mercury in San Francisco Bay forage fish to surface sediments. Environ Sci Technol 2011; 45: 1264–1270. [DOI] [PubMed] [Google Scholar]
- Glass GE, Leonard EN, Chan WH, Orr DB. Airborne Mercury in Precipitation in the Lake Superior Region. J Great Lakes Res 1986; 12: 37–51. [Google Scholar]
- Gratz LE, Keeler GJ, Blum JD, Sherman LS. Isotopic Composition and Fractionation of Mercury in Great Lakes Precipitation and Ambient Air Environ Sci Technol 2010; 44: 7764–7770. [DOI] [PubMed] [Google Scholar]
- Great Lakes Coastal Wetland Monitoring Program (CWMP). Implementing Great Lakes Coastal Wetland Monitoring Semiannual Progress Report, 2016, Report EPAGLNPO-2010-H-3–984-758. https://www.greatlakeswetlands.org/docs/Reports/GLIC-CWM-5yr-summary2010_2016-final.pdf [accessed 01-19-21].
- Hall BD, Manolopoulos H, Hurley JP, Schauer JJ, St. Louis VL, Kenski D, et al. Methyl and total mercury in precipitation in the Great Lakes region. Atmos Environ 2005; 39: 7557–7569. [Google Scholar]
- Hammerschmidt CR, Fitzgerald WF. Bioaccumulation and Trophic Transfer of Methylmercury in Long Island Sound. Arch Environ Con Tox 2006; 51: 416–424. [DOI] [PubMed] [Google Scholar]
- Harris RC, Rudd JWM, Amyot M, Babiarz CL, Beaty KG, Blanchfield PJ, et al. Whole-ecosystem study shows rapid fish-mercury response to changes in mercury deposition. Proc Natl Acad Sci 2007; 104: 16586–16591. [DOI] [PMC free article] [PubMed] [Google Scholar]
- Hoffman JC, Blazer VS, Walsh HH, Shaw CH, Braham R, Mazik PM. Influence of demographics, exposure, and habitat use in an urban, coastal river on tumor prevalence in a demersal fish. Sci Total Environ 2020; 712: 136512. [DOI] [PMC free article] [PubMed] [Google Scholar]
- Hoffman JC, Kelly JR, Peterson GS, Cotter AM. Landscape-Scale Food Webs of Fish Nursery Habitat Along a River-Coast Mixing Zone. Estuar Coast 2015a; 38: 1335–1349. [Google Scholar]
- Hoffman JC, Sierszen ME, Cotter AM. Fish tissue lipid-C:N relationships for correcting δ13C values and estimating lipid content in aquatic food-web studies. Rapid Commun Mass Spectrom 2015b; 29: 2069–2077. [DOI] [PubMed] [Google Scholar]
- Hoffman JC, Peterson GS, Cotter AM, Kelly JR. Using Stable Isotope Mixing in a Great Lakes Coastal Tributary to Determine Food Web Linkages in Young Fishes. Estuar Coast 2010; 33: 1391–1405. [Google Scholar]
- [Dataset].Janssen Sarah E., 2020, Assessment of Mercury Cycling in the Saint Louis River, Minnesota, using Mercury and Food Web (Carbon and Nitrogen) Stable Isotopes: U.S. Geological Survey Data Release, 10.5066/P9EOTIR3. [DOI] [Google Scholar]
- Janssen SE, Riva-Murray K, DeWild JF, Ogorek JM, Tate MT, Van Metre PC, et al. Chemical and Physical Controls on Mercury Source Signatures in Stream Fish from the Northeastern United States. Environ Sci Technol 2019; 53: 10110–10119. [DOI] [PubMed] [Google Scholar]
- Janssen SE, Johnson MW, Blum JD, Barkay T, Reinfelder JR. Separation of monomethylmercury from estuarine sediments for mercury isotope analysis. Chem Geol 2015; 411: 19–25. [Google Scholar]
- Kraus JM, Gibson PP, Walters DM, Mills MA. Riparian spiders as sentinels of polychlorinated biphenyl contamination across heterogeneous aquatic ecosystems. Environ Tox Chem 2017; 36: 1278–1286. [DOI] [PMC free article] [PubMed] [Google Scholar]
- Kraus JM, Walters DM, Wesner JS, Stricker CA, Schmidt TS, Zuellig RE. Metamorphosis Alters Contaminants and Chemical Tracers in Insects: Implications for Food Webs. Environ Sci Technol 2014; 48: 10957–10965. [DOI] [PubMed] [Google Scholar]
- Larson JH, Trebitz AS, Steinman AD, Wiley MJ, Mazur MC, Pebbles V, et al. Great Lakes rivermouth ecosystems: Scientific synthesis and management implications. J Great Lakes Res 2013; 39: 513–524. [Google Scholar]
- Lee C-S, Fisher NS. Bioaccumulation of methylmercury in a marine diatom and the influence of dissolved organic matter. Mar Chem 2017; 197: 70–79. [DOI] [PMC free article] [PubMed] [Google Scholar]
- Lepak R, Yin R, Krabbenhoft DP, Ogorek JM, DeWild JF, Holsen TM, et al. Use of Stable Isotope Signatures to Determine Mercury Sources in the Great Lakes. Environ Sci Technol Let 2015a; 2: 335–341. [Google Scholar]
- Lepak RF; Krabbenhoft DP; Ogorek JM; Tate MT; Bootsma HA; Hurley JP, Influence of Cladophora–Quagga Mussel Assemblages on Nearshore Methylmercury Production in Lake Michigan. Environ Sci Technol 2015b, 49, (13), 7606–7613. [DOI] [PubMed] [Google Scholar]
- Lepak RF, Hoffman JC, Janssen SE, Krabbenhoft DP, Ogorek JM, DeWild JF, et al. Mercury source changes and food web shifts alter contamination signatures of predatory fish from Lake Michigan. Proc Natl Acad Sci 2019; 116: 23600–23608. [DOI] [PMC free article] [PubMed] [Google Scholar]
- Lepak RF, Janssen SE, Yin R, Krabbenhoft DP, Ogorek JM, DeWild JF, et al. Factors Affecting Mercury Stable Isotopic Distribution in Piscivorous Fish of the Laurentian Great Lakes. Environ Sci Technol 2018; 52: 2768–2776. [DOI] [PubMed] [Google Scholar]
- Madenjian CP, Janssen SE, Lepak RF, Ogorek JM, Rosera TJ, DeWild JF, et al. Mercury Isotopes Reveal an Ontogenetic Shift in Habitat Use by Walleye in Lower Green Bay of Lake Michigan. Environ Sci Technol Let 2019; 6: 8–13. [Google Scholar]
- Monson BA. Trend Reversal of Mercury Concentrations in Piscivorous Fish from Minnesota Lakes: 1982−2006. Environ Sci Technol 2009; 43: 1750–1755. [DOI] [PubMed] [Google Scholar]
- Ortega-Rodriguez CL, Chumchal MM, Drenner RW, Kennedy JH, Nowlin WH, Barst BD, et al. Relationship between methylmercury contamination and proportion of aquatic and terrestrial prey in diets of shoreline spiders. Environ Tox Chem 2019; 38: 2503–2508. [DOI] [PubMed] [Google Scholar]
- Phillips DL, Gregg JW. Uncertainty in source partitioning using stable isotopes. Oecologia 2001; 127: 171–179. [DOI] [PubMed] [Google Scholar]
- Robertson DM, Saad DA. Nutrient Inputs to the Laurentian Great Lakes by Source and Watershed Estimated Using SPARROW Watershed Models. J Am Water Resour Assoc 2011; 47: 1011–1033. [DOI] [PMC free article] [PubMed] [Google Scholar]
- Sherman LS, Blum JD, Dvonch JT, Gratz LE, Landis MS. The use of Pb, Sr, and Hg isotopes in Great Lakes precipitation as a tool for pollution source attribution. Sci Total Environ 2015; 502: 362–374. [DOI] [PubMed] [Google Scholar]
- Sierszen ME, Morrice JA, Trebitz AS, Hoffman JC. A review of selected ecosystem services provided by coastal wetlands of the Laurentian Great Lakes. Aquat Ecosyst Health Manag 2012; 15: 92–106. [Google Scholar]
- Sorensen J, Sydor M, Huls H, Costello M. Analyses of Lake Superior Seiche Activity for Estimating Effects on Pollution Transport in the St. Louis River Estuary under Extreme Conditions. J Great Lakes Res 2004; 30: 293–300. [Google Scholar]
- Stevens DL, Olsen AR. Spatially Balanced Sampling of Natural Resources. J Am Stat Assoc 2004; 99: 262–278. [Google Scholar]
- Trebitz AS, Hoffman JC. Coastal Wetland Support of Great Lakes Fisheries: Progress from Concept to Quantification. Transactions of the American Fisheries Society 2015; 144: 352–372. [Google Scholar]
- Trebitz AS. Characterizing seiche and tide-driven daily water level fluctuations affecting coastal ecosystems of the Great Lakes. J Great Lakes Res 2006; 32: 102–116. [Google Scholar]
- Tsui MT-K, Blum JD, Kwon SY. Review of stable mercury isotopes in ecology and biogeochemistry. Sci Total Environ 2020a; 716: 135386. [DOI] [PubMed] [Google Scholar]
- Tsui MT-K, Uzun H, Ruecker A, Majidzadeh H, Ulus Y, Zhang H, et al. Concentration and isotopic composition of mercury in a blackwater river affected by extreme flooding events. Limnology and Oceanography 2020b; 65: 2158–2169. [Google Scholar]
- Tsui MT, Blum JD, Kwon SY, Finlay JC, Balogh SJ, Nollet YH. Sources and transfers of methylmercury in adjacent river and forest food webs. Environ Sci Technol 2012; 46: 10957–64. [DOI] [PubMed] [Google Scholar]
- Tsui MTK, Finlay JC. Influence of Dissolved Organic Carbon on Methylmercury Bioavailability across Minnesota Stream Ecosystems. Environmental Science & Technology 2011; 45: 5981–5987. [DOI] [PubMed] [Google Scholar]
- U.S.EPA. Method 7473 (SW-846): Mercury in Solids and Solutions by Thermal Decomposition, Amalgamation, and Atomic Absorption Spectrophotometry. Revision 0, 1998. [Google Scholar]
- U.S.EPA. Method 1630: Methyl Mercury in Water by Distillation, Aqueous Ethylation, Purge and Trap, and CVAFS, Washington D.C., 2001. [Google Scholar]
- U.S. EPA. Method 1631: Mercury in Water by Oxidation, Purge and Trap, and Cold Vapor Atomic Fluorescence Spectrometry, Washington D.C., 2002. [Google Scholar]
- U.S. EPA Restoring Great Lakes Areas of Concern Retrieved [June 24 2020] from https://www.epa.gov/great-lakes-aocs/restoring-great-lakes-areas-concern.
- Walters DM, Fritz KM, Otter RR. The dark side of subsidies: adult stream insects export organic contaminants to riparian predators. Ecol Appl 2008; 18: 1835–1841. [DOI] [PubMed] [Google Scholar]
- Woerndle GE, Tsz-Ki Tsui M, Sebestyen SD, Blum JD, Nie X, Kolka RK. New Insights on Ecosystem Mercury Cycling Revealed by Stable Isotopes of Mercury in Water Flowing from a Headwater Peatland Catchment. Environ Sci Technol 2018; 52: 1854–1861 [DOI] [PubMed] [Google Scholar]
- Wu L, Culver DA. Ontogenetic Diet Shift in Lake Erie Age-0 Yellow Perch (Perca flavescens): A Size-Related Response to Zooplankton Density. Can J Fish Aquat Sci 1992; 49: 1932–1937. [Google Scholar]
- Yin R, Krabbenhoft DP, Bergquist BA, Zheng W, Lepak RF, Hurley JP. Effects of mercury and thallium concentrations on high precision determination of mercury isotopic composition by Neptune Plus multiple collector inductively coupled plasma mass spectrometry. J Anal At Spectrom 2016a; 31: 2060–2068. [Google Scholar]
- Yin R, Lepak RF, Krabbenhoft DP, Hurley JP. Sedimentary records of mercury stable isotopes in Lake Michigan. Elem Sci Anth 2016b; 4: 86. [DOI] [PMC free article] [PubMed] [Google Scholar]
- Zheng W, Hintelmann H. Isotope Fractionation of Mercury during Its Photochemical Reduction by Low-Molecular-Weight Organic Compounds. J Phys Chem A 2010; 114: 4246–4253. [DOI] [PubMed] [Google Scholar]
Associated Data
This section collects any data citations, data availability statements, or supplementary materials included in this article.