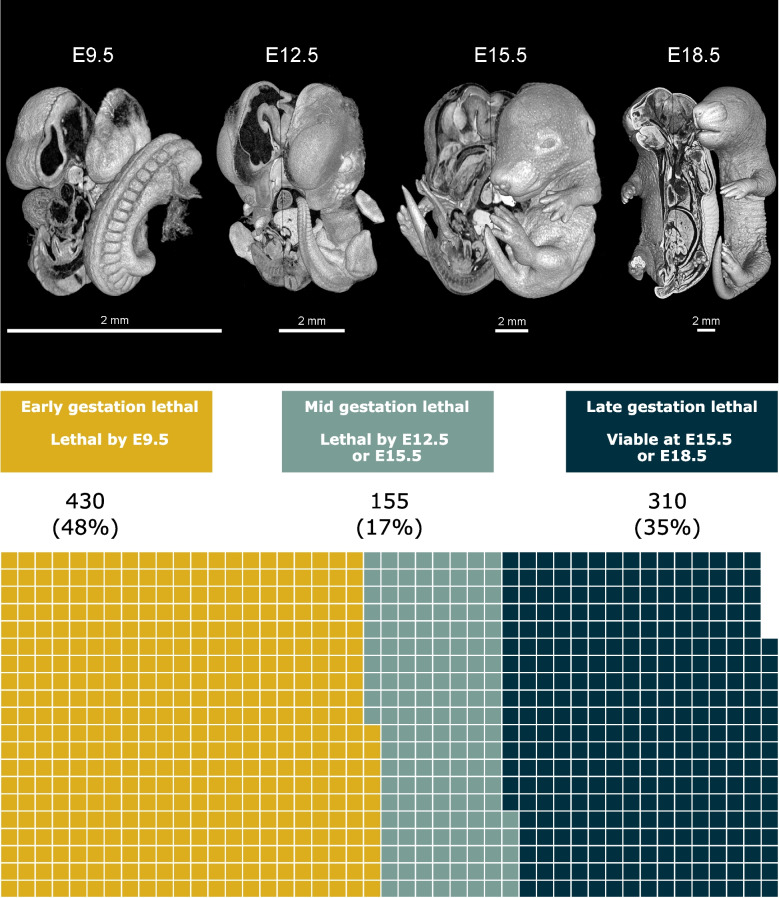
Fig. 1.
Description of WoL and distribution of lethal genes across these windows. Three-dimensional microCT images of wild-type mouse embryos corresponding to E9.5, E12.5, E15.5 and E18.5. The waffle chart shows the total number of lethal genes characterised through the secondary viability screening and their distribution by WoL. EL genes, where the embryo dies before E9.5 constitute nearly 50% of all the lethal genes in this dataset. This stage broadly correlates with the pre-organogenesis phase of embryonic development. Non-early lethal genes are divided into ML (17%) and LL (35%). The complete set of genes associated with each WoL is available in File S1 [33]. WoL, windows of lethality; E, embryonic day; EL, early gestation lethal; ML, mid gestation lethal; LL, late gestation lethal

