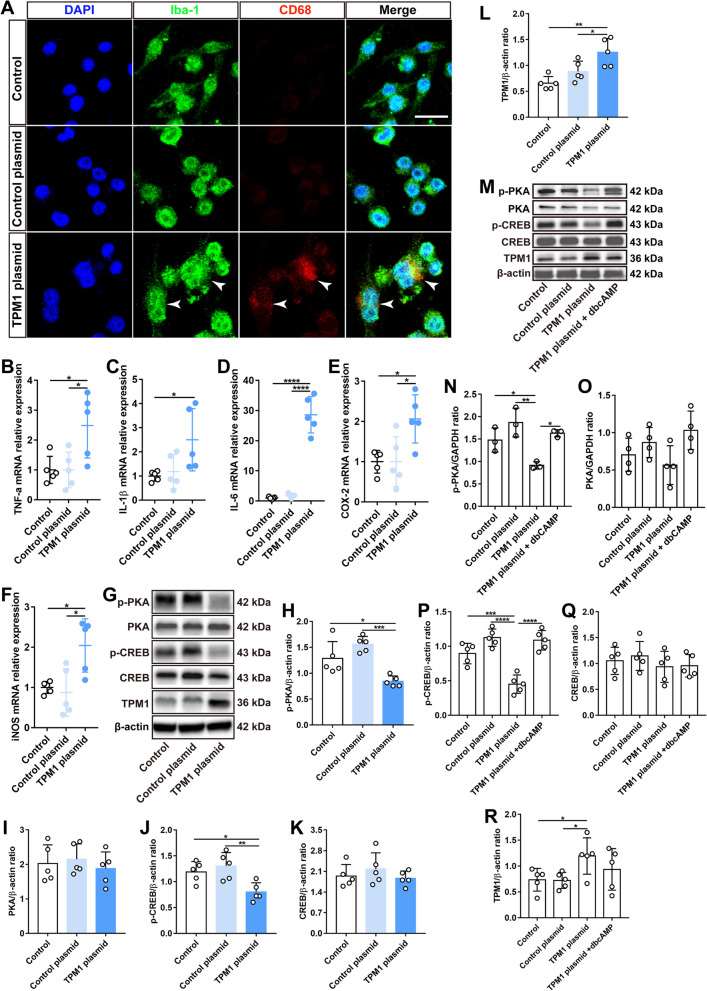
Fig. 1.
TPM1 induces inflammation by regulating the PKA/CREB pathway in BV2 cells. A Immunostaining of BV2 cells with antibodies against Iba-1 and CD68 after treatment with TPM1 plasmid or control plasmid. Arrowheads show the colocalization of Iba-1-positive microglial cells with CD68 signal. Scale bar, 20 µm. B–F qPCR analysis of TNF-α, IL-1β, IL-6, COX-2 and iNOS in BV2 cells treated with TPM1 plasmid or control plasmid. Data are presented as mean ± SEM and analyzed by one-way ANOVA with Tukey’s multiple comparison test (compared to TPM1 plasmid, *p < 0.05, ****p < 0.001). Five independent experiments were performed. G–L Western blot analysis (G) and quantification of p-PKA, PKA, p-CREB, CREB and TPM1 (H–L) in BV2 cells following TPM1 plasmid or control plasmid treatment. Data are presented as mean ± SEM and analyzed by one-way ANOVA with Tukey’s multiple comparison test (compared to TPM1 plasmid, *p < 0.05, **p < 0.01, ***p < 0.001). Five independent experiments were performed. M–R Western blot analysis (M) and quantification of p-PKA, PKA, p-CREB, CREB and TPM1 (N–R) in BV2 cells treated by TPM1 plasmid or control plasmid and followed by dbcAMP treatment. Data are presented as mean ± SEM analyzed by one-way ANOVA with Tukey’s multiple comparison test (compared to TPM1 plasmid, *p < 0.05, **p < 0.01, ***p < 0.001 ****p < 0.001)

