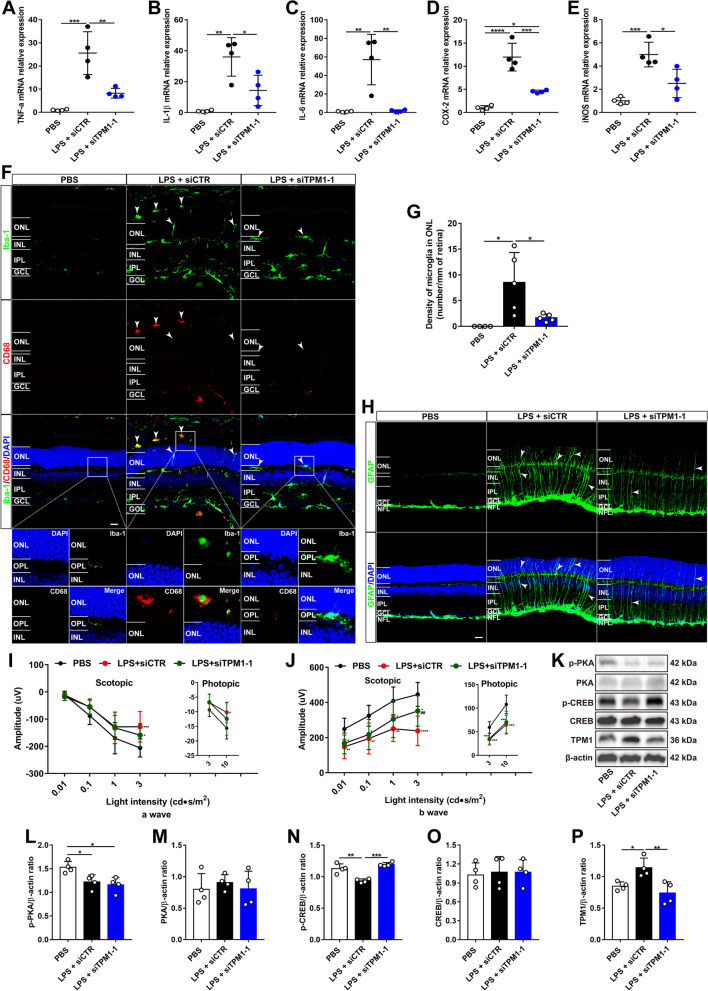
Fig. 2.
TPM1 knockdown reduces LPS-induced inflammation and function decline via the PKA/CREB pathway in vivo. A–E qPCR analysis of TNF-α, IL-1β, IL-6, COX-2 and iNOS in C57BL/6J mice after treatments with PBS, or with LPS and siTPM1-1 or siCTR. Data are presented as mean ± SEM and analyzed by one-way ANOVA with Tukey’s multiple comparison test (compared to LPS + siCTR, *p < 0.05, **p < 0.01, ***p < 0.001, ****p < 0.001), n = 4 mice in each group. F, G Representative confocal images of microglia from retinal sections stained with antibodies against Iba-1 and CD68 (F) and quantification of microglial cell density in the ONL (G) of C57BL/6J mice following treatments with PBS, or with LPS and siTPM1-1 or siCTR. Data are presented as mean ± SEM and analyzed by one-way ANOVA with Tukey’s multiple comparison test (compared to LPS + siCTR, *p < 0.05), n = 5 mice in each group. Arrowheads show the migration of activated microglia to the ONL. The boxed regions are highly magnified at the bottom showing migrated microglia in the ONL. Scale bars, 20 µm. H Retina sections stained with GFAP antibody. Arrowheads show activated astrocytes and Müller cells. Scale bars, 20 µm. I, J ERG recording in C57BL/6J mice after treatments with PBS, or with LPS and siTPM1-1 or siCTR. Data are presented as mean ± SEM and analyzed by one-way ANOVA with Tukey’s multiple comparison test (compared to PBS, *p < 0.05, **p < 0.01, ***p < 0.001, ****p < 0.001; LPS + siCTR vs. LPS + siTPM1-1, ##p < 0.01), n = 10 mice in each group. K–P Western blot analysis (K) and quantification of p-PKA, PKA, p-CREB, CREB and TPM1 (L–P) in C57BL/6J mice following treatments with PBS, or with LPS and siTPM1-1 or siCTR. Data are presented as mean ± SEM and analyzed by one-way ANOVA with Tukey’s multiple comparison test (compared to PBS or LPS + siCTR, *p < 0.05, **p < 0.01, ***p < 0.001). n = 4 mice in each group

