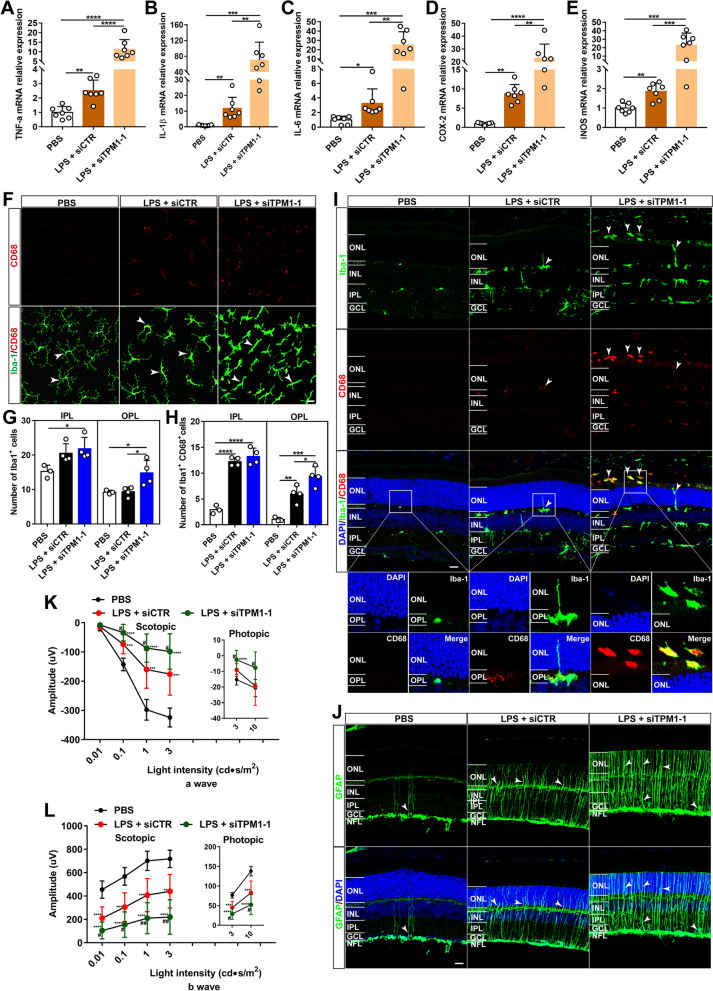
Fig. 3.
TPM1 knockdown exacerbates inflammation in the TREM2−/− mouse retina. A–E qPCR analysis of TNF-α, IL-1β, IL-6, COX-2 and iNOS in TREM2−/− mice after treatments with PBS, or with LPS and siTPM1-1 or siCTR. Data are presented as mean ± SEM and analyzed by one-way ANOVA with Tukey’s multiple comparison test (compared to PBS or LPS + siCTR, *p < 0.05, **p < 0.01, ***p < 0.001, ****p < 0.001), n = 7 mice in each group. F–H, Retina whole-mounts stained with antibodies against Iba-1 and CD68 (F) and quantification of numbers of Iba-1+ (G) and of Iba-1+CD68+ microglia (H) in the IPL and OPL of TREM2−/− retinas after treatments with PBS, or with LPS and siTPM1-1 or siCTR. Data are presented as mean ± SEM and analyzed by one-way ANOVA with Tukey’s multiple comparison test (compared to PBS or LPS + siCTR, *p < 0.05, **p < 0.01, ***p < 0.001, ****p < 0.001). n = 3 in PBS group, n = 4 in LPS + siCTR/siTPM1-1 group. Arrowheads show microglia, scale bar, 20 µm. I Retina sections stained with Iba-1 and CD68 antibodies in TREM2−/− retinas following treatments with PBS, or with LPS and siTPM1-1 or siCTR. Arrowheads show the migration of activated microglia to the ONL. The boxed regions are highly magnified at the bottom showing migrated microglia in the ONL. Scale bars, 20 µm. J Retina sections stained with an antibody against GFAP in TREM2−/− retinas after treatments with PBS, or with LPS and siTPM1-1 or siCTR. Arrowheads show activated astrocytes and Müller cells. Scale bars, 20 µm. K, L Scotopic and photopic electroretinogram (ERG) recordings on TREM2−/− mice. Data are presented as mean ± SEM and analyzed by one-way ANOVA with Tukey’s multiple comparison test (compared to PBS, **p < 0.01, ***p < 0.001, ****p < 0.001; LPS + siCTR vs. LPS + siTPM1-1, #p < 0.05, ##p < 0.01). n = 13, 10, 11 mice in PBS, LPS + siCTR, and LPS + siTPM1-1 groups, respectively

